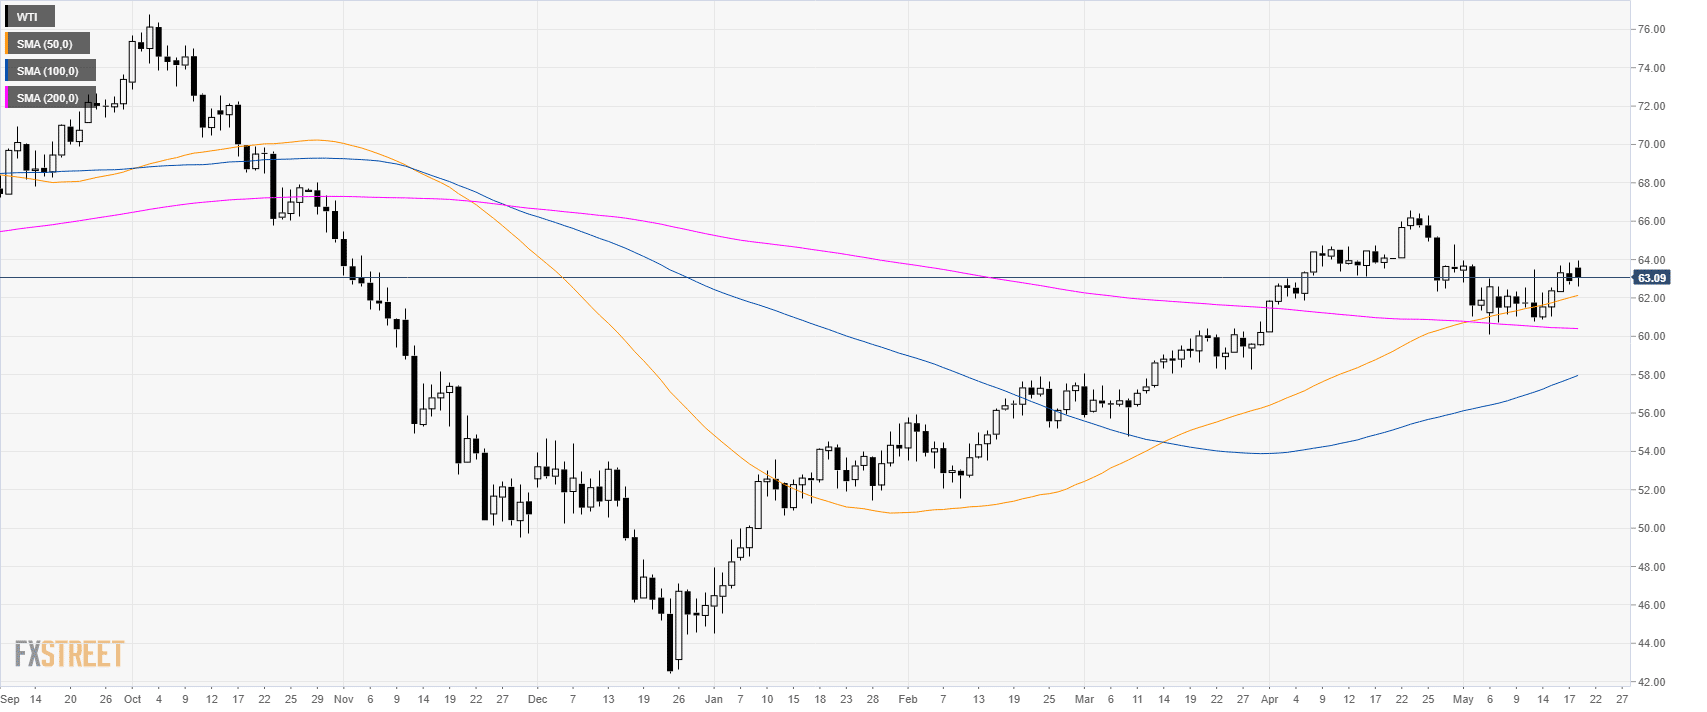
Oil daily chart
WTI (West Texas Intermediate) is trading in a bull trend above its main simple moving averages (SMAs)
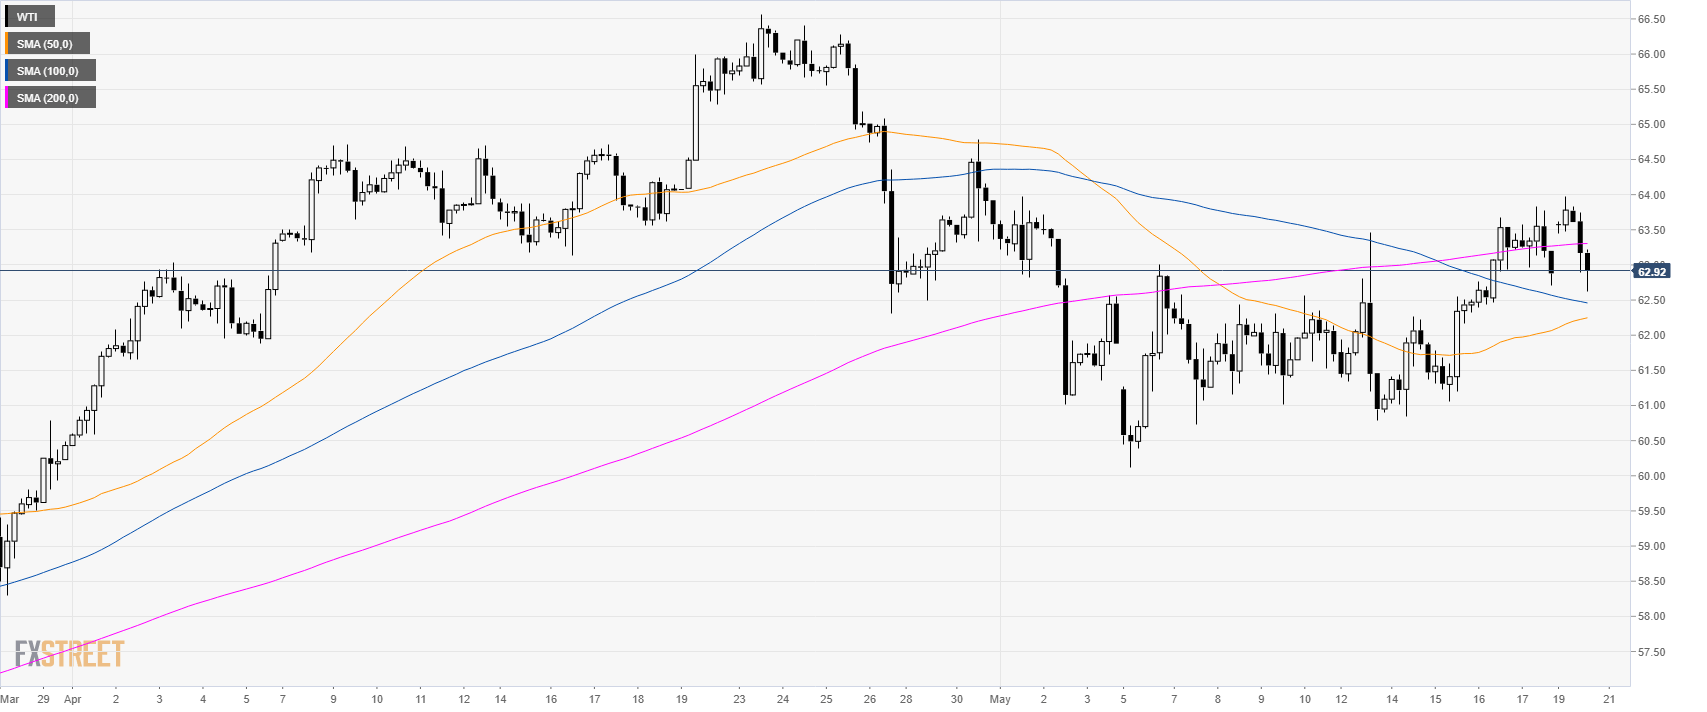
Oil 4-hour chart
WTI is in consolidation mode between the 200 and 100 SMA.
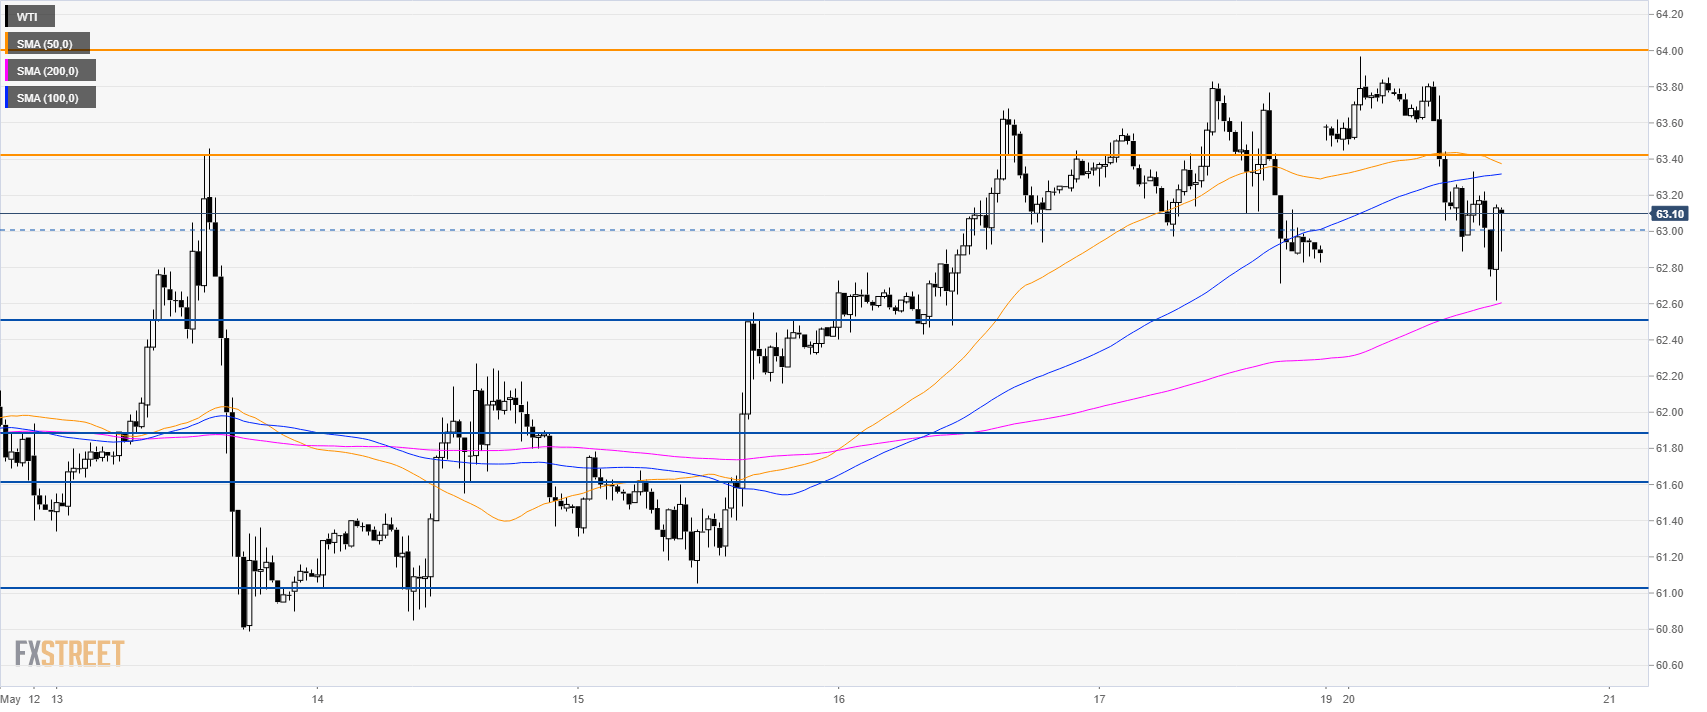
Oil 30-minute chart
WTI is trading near the 63.00 figure and below the 50/100 SMAs suggesting further consolidation in the short term. The market could revisit 63.40 and 64.00 resistances. A break below 62.50 support can lead to an acceleration down to 61.90 and 61.60 level.
Additional key levels
