- Crude oil remains undecided where to go next on the second day of the week.
- The level to beat for bulls is the 57.50 resistance.
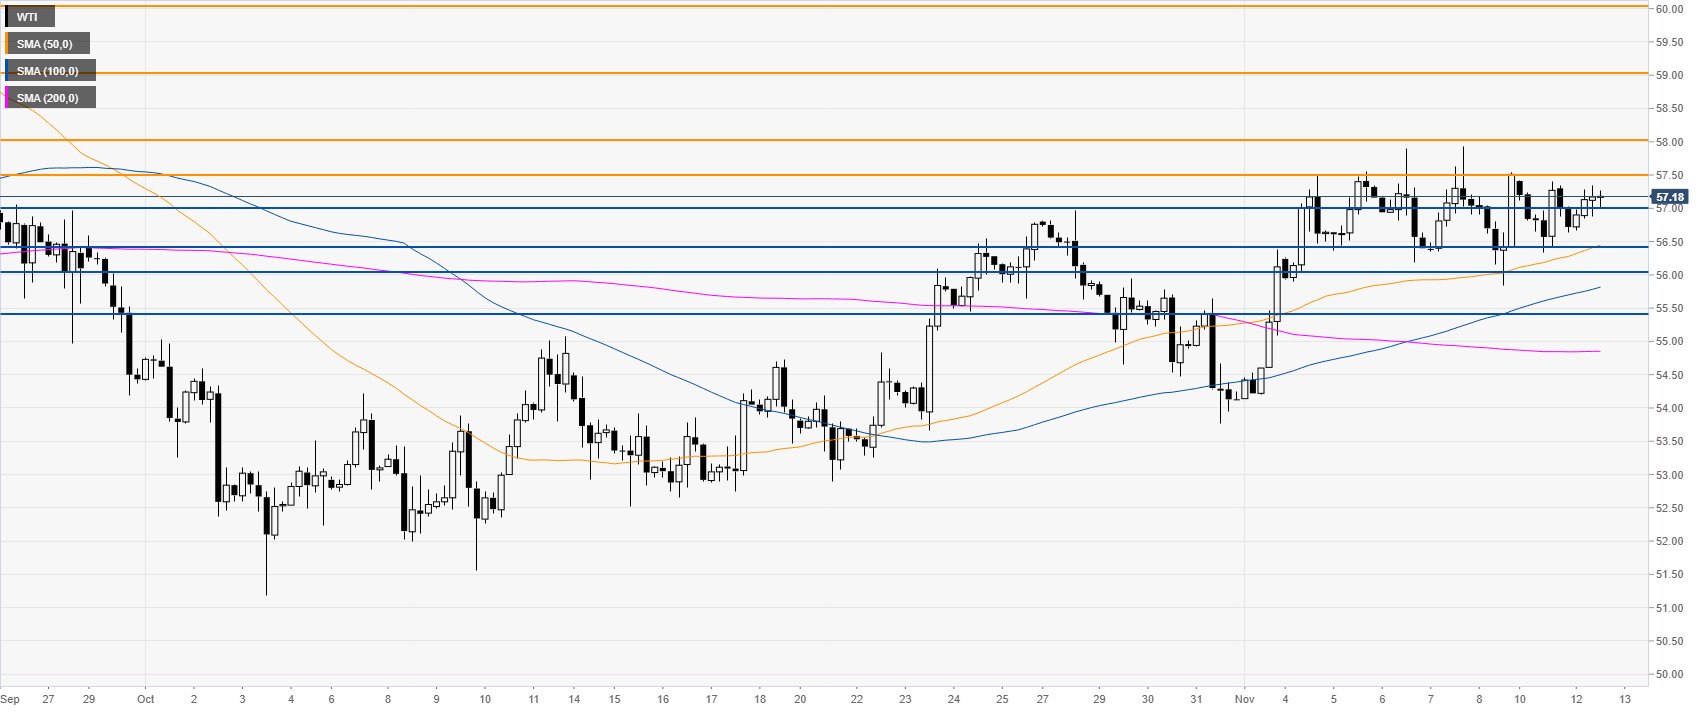
Crude oil daily chart
The crude oil West Texas Intermediate (WTI) is currently holding above $57.00 a barrel and below the 200-day simple moving average (DMA). The market has been consolidating for more than a week.

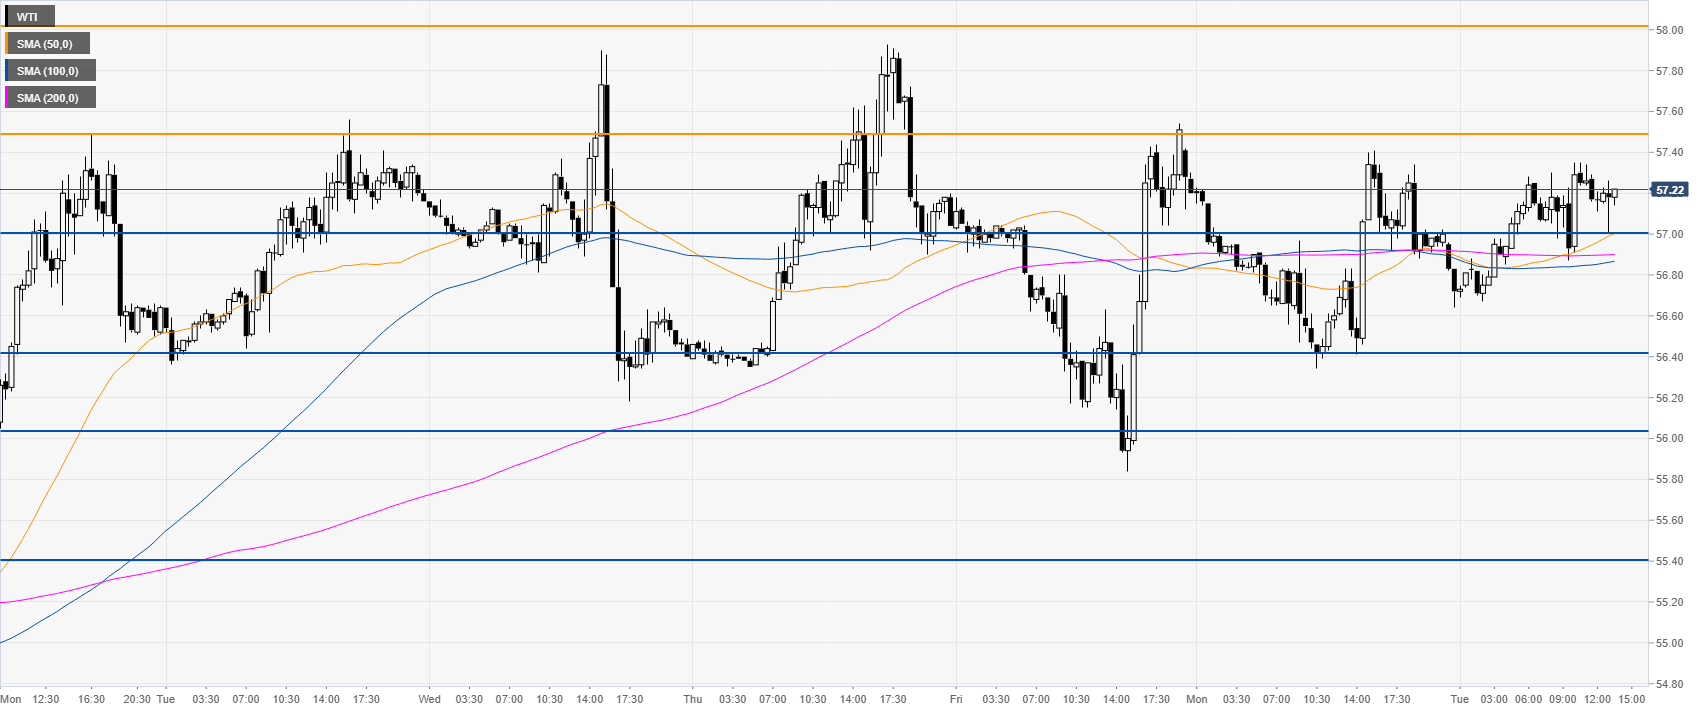
Crude oil four-hour chart
WTI is trading above the main SMAs, keeping the bullish momentum intact above the 56.00 support level. Buyers are likely looking for a daily breakout above the 57.50 level to travel north towards the 58.00, 59.00 and 60.00 price levels.
Crude oil 30-minute chart
The market remains sidelined around the 57.00 handle, currently above the main SMAs. Support is seen at the 57.00 level followed by 56.40 and the 56.00 figure.
Additional key levels
