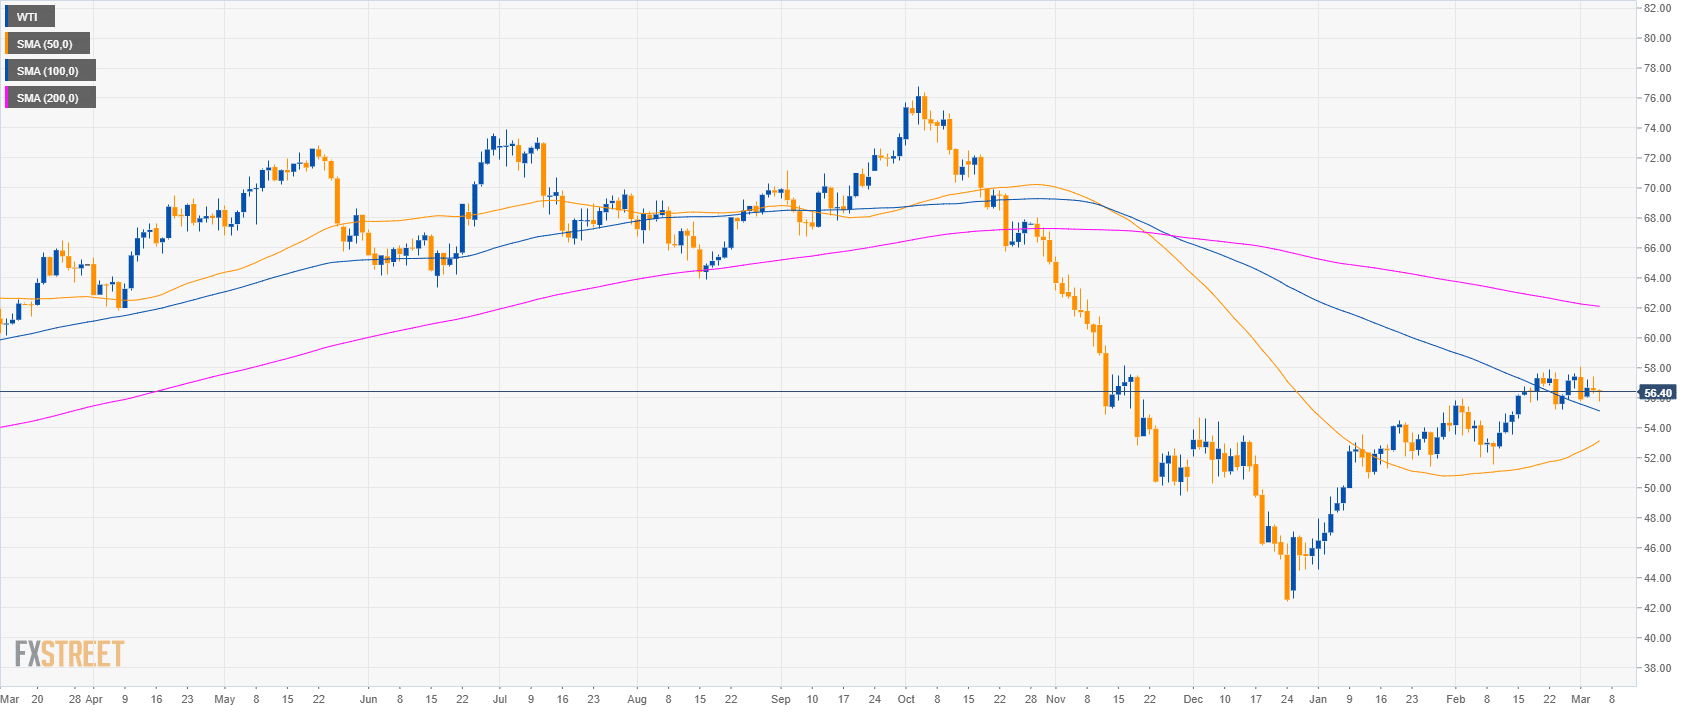
Oil daily chart
- Oil is trading above the 50 and 100-day simple moving averages (SMAs) suggesting a mild bullish bias.
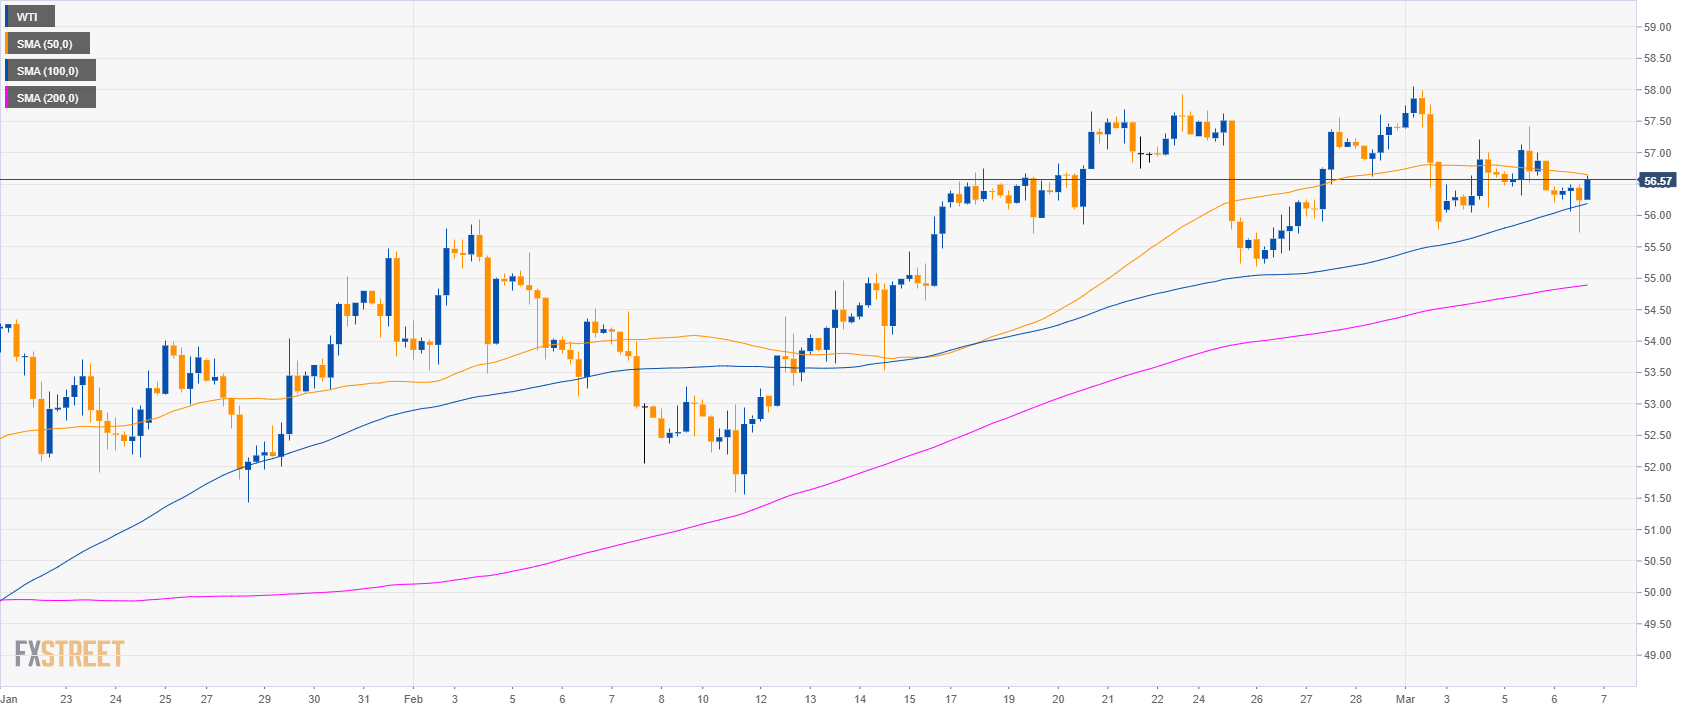
Oil 4-hour chart
- Crude oil WTI is trading above the 100 and 200 SMAs suggesting a bullish bias in the medium-term.
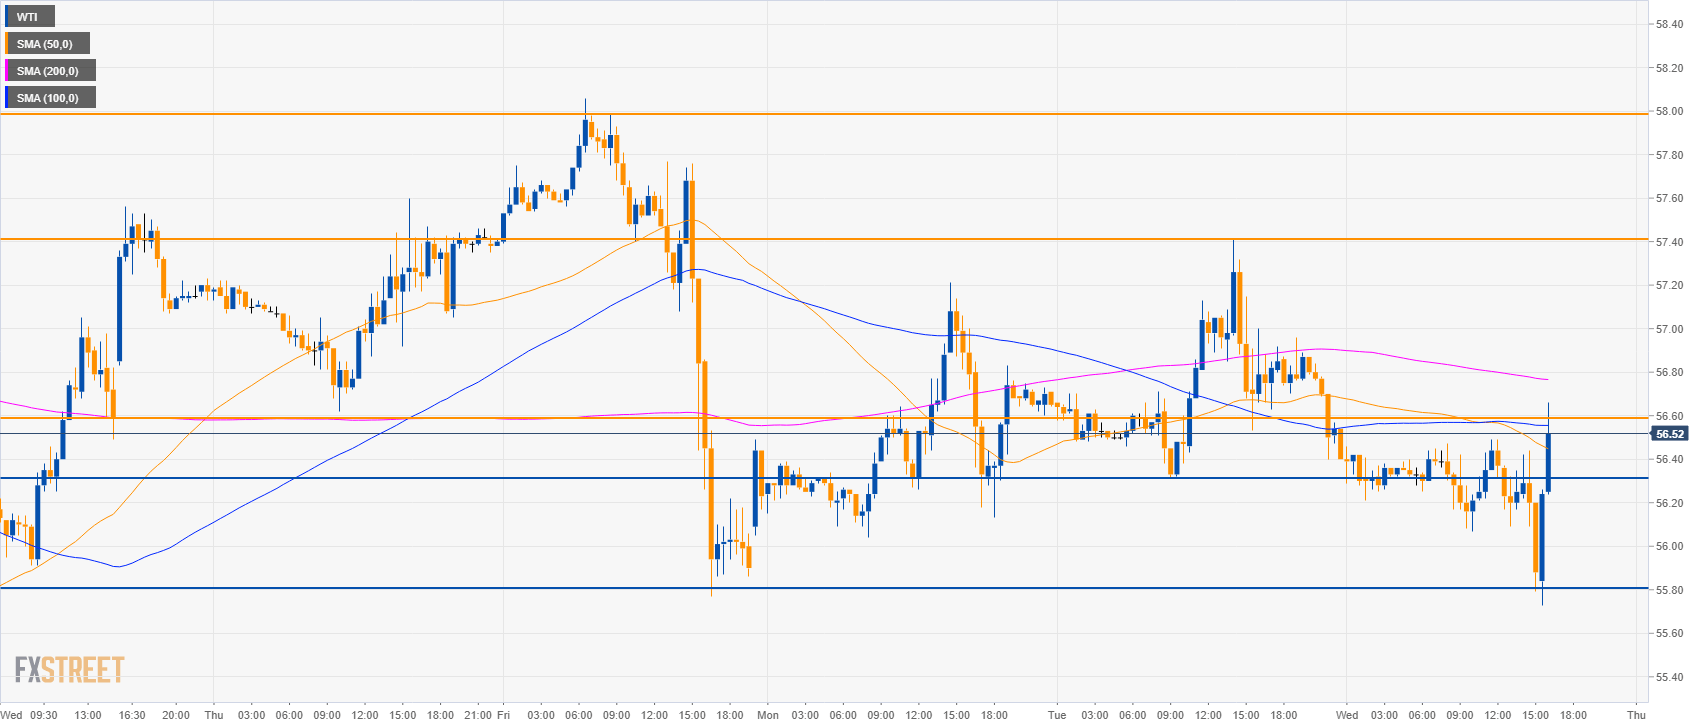
Oil 30-minute chart
- Bulls are trying to break above 56.60 resistance in order to reach 57.40 and 58.00 level.
- To the downside, support is at 56.30 and 55.80 level.
Additional key levels
WTI
Overview:
Today Last Price: 56.24
Today Daily change: -26 pips
Today Daily change %: -0.46%
Today Daily Open: 56.5
Trends:
Daily SMA20: 55.58
Daily SMA50: 53.05
Daily SMA100: 54.31
Daily SMA200: 62.14
Levels:
Previous Daily High: 57.41
Previous Daily Low: 56.31
Previous Weekly High: 58.06
Previous Weekly Low: 55.19
Previous Monthly High: 57.92
Previous Monthly Low: 51.56
Daily Fibonacci 38.2%: 56.73
Daily Fibonacci 61.8%: 56.99
Daily Pivot Point S1: 56.07
Daily Pivot Point S2: 55.64
Daily Pivot Point S3: 54.97
Daily Pivot Point R1: 57.17
Daily Pivot Point R2: 57.84
Daily Pivot Point R3: 58.27
