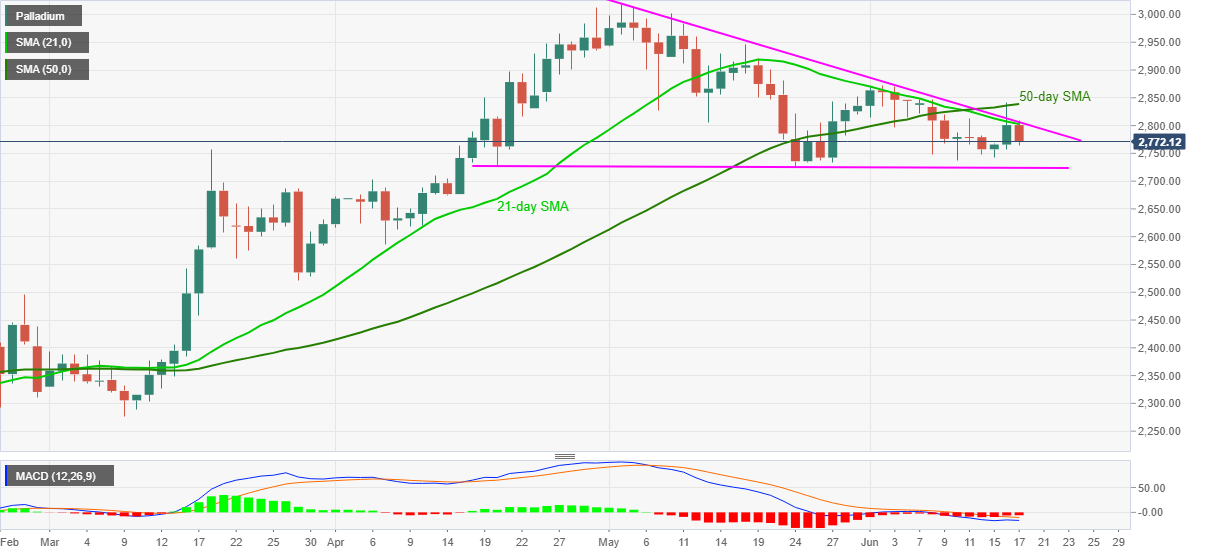
- Palladium prices remain pressured after reversing from seven-day top.
- Confluence of 21-day SMA, six-week-old resistance line guards nearby upside.
- 50-day SMA adds to the resistances, sellers aim for two-month-long support.
Palladium (XPD/USD) bounces off intraday low, down 1.0% around $2,772, heading into Thursday’s European session. The precious metal rallied to June 08 top the previous day but failed to cross neither 50-day SMA nor a convergence of 21-day SMA and descending trend line from May 04.
Read: Federal Reserve ups the ante on inflation, growth and interest rates
The recent pullback joins the bearish MACD signals to keep sellers hopeful. However, a horizontal line, forming part of a two-month-old descending triangle bullish pattern, tests the Palladium bears around $2,725.
Also acting as the downside filter is the $2,700 threshold surrounding multiple tops marked during late March and early April.
Meanwhile, a daily closing beyond $2,805 resistance confluence needs to cross the 50-day SMA level of $2,840 to recall the XPD/USD buyers.
Following that, the late May high near $2,945 and the $3,000 psychological magnet could lure the bulls ahead of the recent tops, also the record high, close to $3,020.
Palladium daily chart
Trend: Further weakness expected
