This chart shows the daily USD/CAD, with Ichimoku indicator applied. The red line across the chart is the Kijun Sen, or the median price level for the past 26 periods.
Ichimoku theory suggests that a flat horizontal Kijun Sen is like a magnet, or equilibrium, drawing prices back to it. We saw this happening in the green shaded box, where price deviated too far from the Kijun Sen and later retraced.
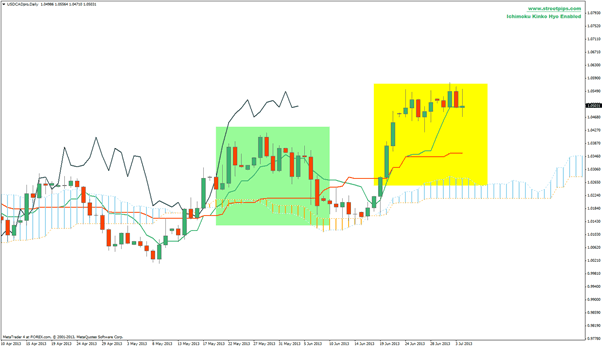
We are seeing the same behaviour currently, in the yellow shaded box. Prices have once again shot up far ahead of the equilibrium line, and a retracement is likely. Traders can wait for a retracement before resuming a long position. Kijun Sen, or the quilibrium, is currently at the 1.0357 level.
Written By: Streetpips.com
Streetpips.com scans books and websites for trading strategy ideas. We then select those which are programmable, code them, and share these with our members.
