- Silver struggled to capitalize on the previous day’s positive move to three-day tops.
- A short-term ascending channel constitutes the formation of a bearish flag pattern.
- Technical indicators on the daily chart further add credence to the negative outlook.
Silver witnessed some selling during the first half of the trading action on Wednesday and eroded a part of the previous day’s strong positive move to three-day tops. The XAG/USD maintained its offered tone through the early European session, albeit has managed to recover a part of its intraday losses. The commodity was last seen hovering around the $25.75-80 region, still down over 1% for the day.
Meanwhile, the recent bounce from the $24.85-80 region, or five-week lows touched last Friday has been along a descending channel. Given the recent sharp fall, the channel constitutes the formation of a bearish flag on short-term charts. The bearish set-up is reinforced by the fact that the XAG/USD has been struggling to capitalize on attempted recovery moves beyond the $26.00 mark. Moreover, oscillators on the daily chart have just started drifting into the negative territory.
Hence, a subsequent slide towards the trend-channel support, near the $25.20 region, en-route the key $25.00 psychological mark, remains a distinct possibility. Some follow-through selling below the $24.85-80 region will reaffirm the bearish breakdown. The XAG/USD might then turn vulnerable and accelerate the downfall further towards challenging the very important 200-day SMA support, currently around the $24.00 round-figure mark.
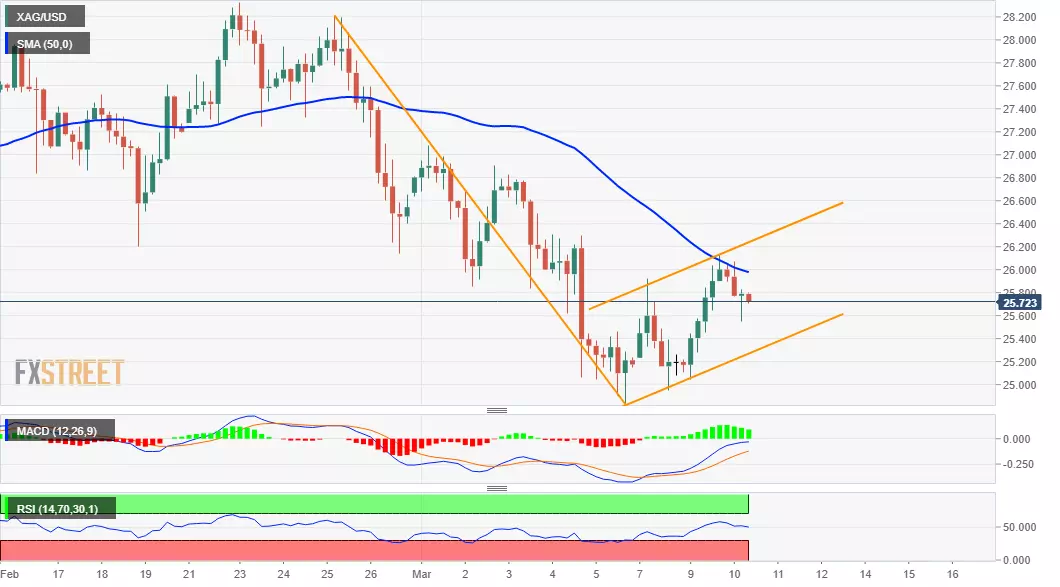
On the flip side, any meaningful recovery attempt would be seen as a selling opportunity and continue to confront resistance near the $26.00 mark. This, in turn, should cap the upside for the XAG/USD near the trend-channel hurdle, around the $26.20 area.
XAG/USD 4-hourly chart
Technical levels to watch
