- Silver extends pullback moves from $18.39 to visit three-day low.
- 200-bar SMA could please the bears following confirmation of the bearish chart pattern.
- A descending trend line from September 2019 becomes the key resistance.
Silver prices drop to $17.84, down 1.30% on a day, during the pre-European session on Wednesday. Even so, the white metal is yet to confirm a bearish technical formation, rising wedge, on the four-hour chart to confirm further selling.
As a result, sellers will look for fresh entries below $17.56 while aiming a 200-bar SMA level of $16.10. Though, May 22 bottom surrounding $16.73 could offer intermediate stop during the fall.
In a case where the bears dominate past-$16.10, April month high near $15.85 will be in the spotlight.
Alternatively, $18.55/56 becomes the key upside barrier as it represents a downward sloping trend line from September 2019 as well as the short-term bearish formation’s upper line.
If at all the bulls manage to cross $18.56, odds of witnessing an up-move to February month high near $19.00 can’t be ruled out.
Silver daily chart
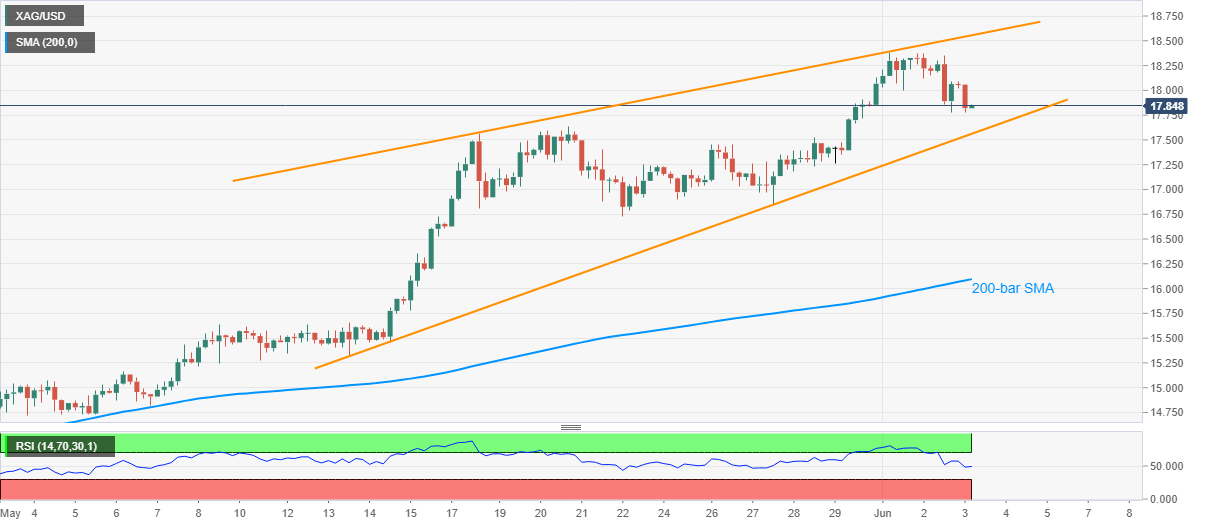
Trend: Further downside expected
