- Silver trims Thursday’s recovery moves from $23.39, losses half a percent intraday.
- 200-HMA can offer immediate support ahead of the triangle’s lower line.
- Key Fibonacci retracements add to the upside barriers.
Silver declines to $23.69, down 0.46% on a day, during the early Asian trading on Friday. Considering the metal’s pullback from $24.16, a weekly symmetrical triangle pops-up on the hourly chart.
With the descending RSI line and the quote’s decline below 38.2% Fibonacci retracement of September 18-24 downside, silver prices are likely to continue its recent weakness.
In doing so, a 200-HMA level of $23.50 can offer nearby rest to the commodity before highlighting the aforementioned triangle’s lower line, at $23.39 now.
Also, multiple highs marked during September 24-25, around $23.35/30, are expected to restrict the metal’s short-term downside.
Meanwhile, the $24.00 round-figure can probe the silver buyers ahead of the triangle’s resistance close to $24.15.
During the quote’s sustained run-up beyond $24.15, 50% and 61.8% Fibonacci retracement levels, $24.45 and $25.10 respectively, can challenge the optimists.
Silver hourly chart
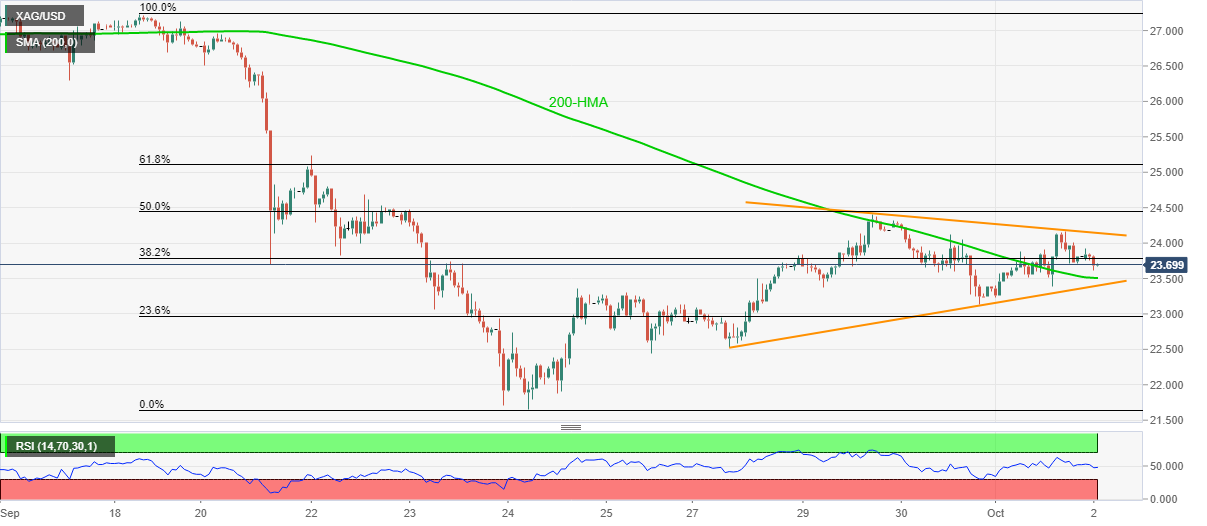
Trend: Sideways
