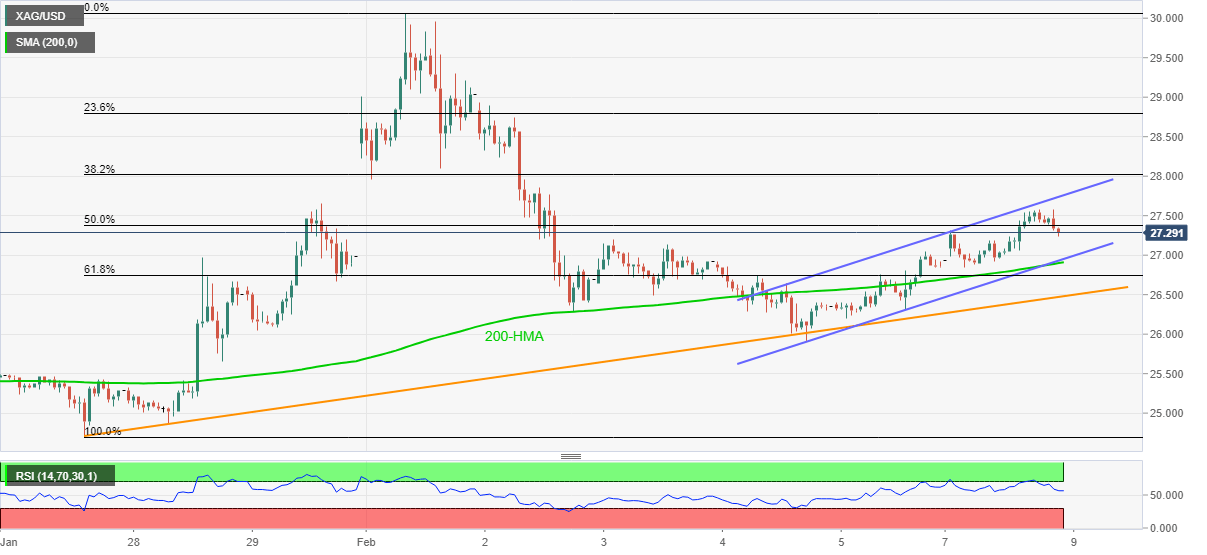
- Silver drops below 50% Fibonacci retracement inside following overbought RSI conditions.
- Ascending trend channel, sustained trading beyond 200-HMA and two-week-long rising support line favor bulls.
Silver drops to $27.28 while trimming some of its gains near one week high amid the initial Asian session on Tuesday. Even so, the white metal stays inside a three-day-old bullish chart pattern, i.e. ascending trend channel, while remaining beyond 200-HMA and a short-term rising trend line.
Although the overbought RSI conditions triggered the quote’s latest pullback, buyers can stay hopeful unless the bullion drops below a confluence of 200-HMA and support line of the stated channel, near $26.90.
Also likely to challenge the silver sellers is the support line from January 27, at $26.46 now. Additionally, 61.8% Fibonacci retracement of January 27 to February 01, near $26.75, offers an extra filter to the south.
Meanwhile, a 50% Fibonacci retracement level of $27.38 and the upper line of the stated channel, at $27.75 now, can probe the silver buyers trying to revisit the $30.00 psychological magnet.
During the run-up, the $28.00 and the February 02 high near $28.75 can test the bulls.
Silver hourly chart
Trend: Bullish
