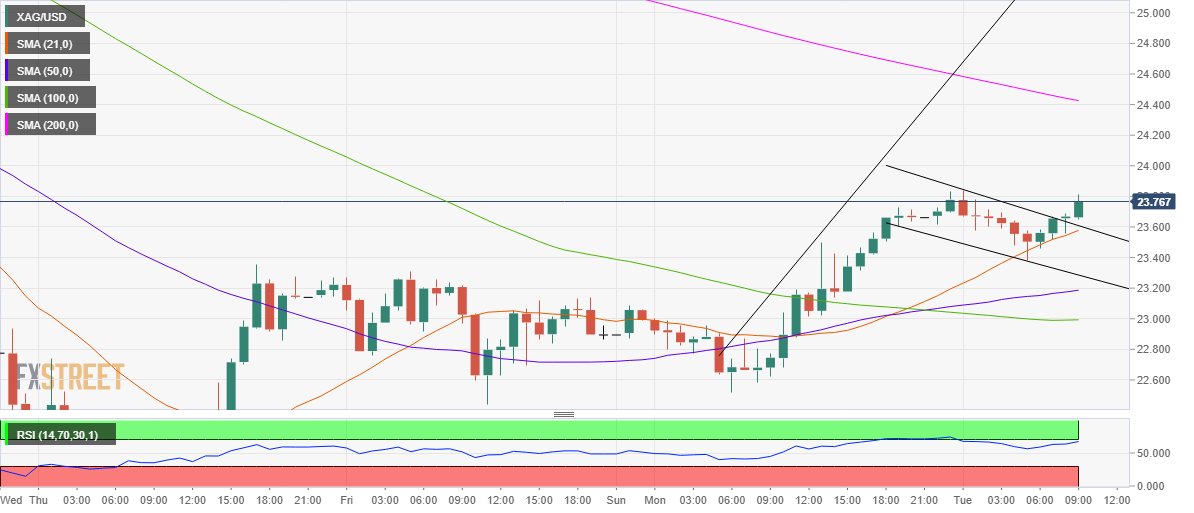
- Silver is set to test the 200-HMA at $24.42 in the near-term.
- Bull flag breakout spotted on the hourly chart.
- Hourly RSI edges higher towards the overbought territory.
The buying interest in Silver (XAG/USD) remains unabated this Tuesday, courtesy of the resumption of the US dollar decline across the board and a bullish technical set up on the hourly chart.
From the near-term technical perspective, the white metal is on track to confront the bearish 200-hourly Simple Moving Average (HMA) at $24.42, in light of a bull flag breakout in the last hour.
The next in sight for the bulls remain the pattern target at $24.55. The hourly Relative Strength Index (RSI) looks north while trending still below the overbought territory, suggesting that there is still room for more upside.
To the downside, the immediate cushion is seen at $23.60, the confluence of the pattern resistance now support and the upward-sloping 21-HMA.
A break below the latter could trigger a fresh drop towards the falling trendline support at $23.28.
All in all, the path of least resistance looks to the upside.
XAG/USD: Hourly chart
XAG/USD: Additional levels
