- XAG/USD attempts a bounce but remains below the $28 mark.
- Silver bears look to extend control after the 4% drop so far.
- Descending triangle breakdown on the 1H chart points to more losses.
Silver (XAG/USD) extends its corrective downside below the $28 mark, having clocked eight-year highs at $30.06, in light of the retail-trade frenzy spurred by Reddit.
Looking at it technically, after the recent rally, the bears have fought back control after the price confirmed a descending triangle breakdown on the hourly chart in early European trading.
Silver Price Chart: Hourly
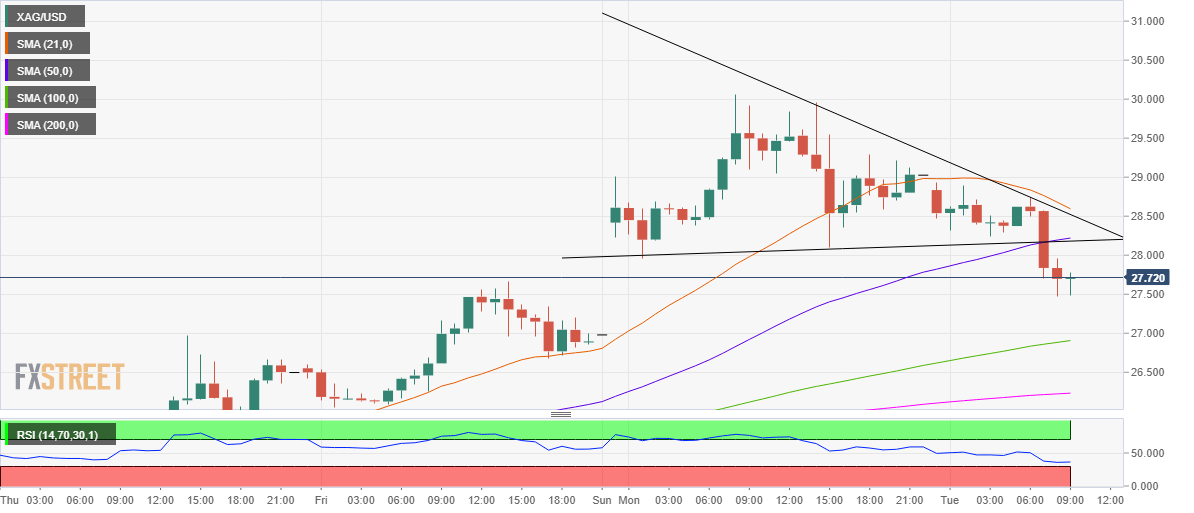
An hourly closing below the critical cap at $28.16, which is the convergence of the 50-hourly moving average (HMA) and the triangle support, has paved the way for further declines.
Silver now targets the upward-sloping 100-HMA at $26.90 where the bears can take a breather.
A breach of the latter would close out Monday’s bullish opening gap, with the 200-HMA level at $26.23 back on the sellers’ radar.
The Relative Strength Index (RSI) points south below the midline, backing the case for additional downside.
Alternatively, a sustained move above the powerful support now resistance at $28.16 is needed if the bulls attempt any recovery.
The next relevant upside barrier is seen around $28.55, the confluence of the triangle resistance and bearish 21-HMA.
Silver Additional levels
