- Silver built on the previous day’s solid intraday bounce from over two-month lows.
- Mixed oscillators on hourly/daily charts warrant some caution for aggressive traders.
- A sustained move beyond the $24.40 supply zone is needed to confirm a bullish bias.
Silver showed some resilience below the very important 200-day SMA on Thursday and stage a solid intraday bounce from over two-month lows.
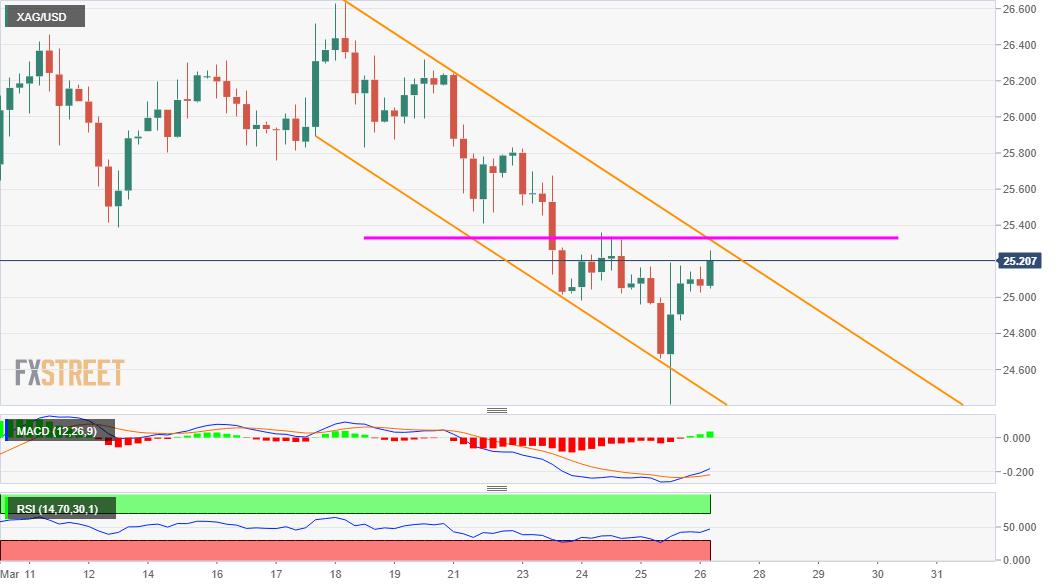
The recovery extended through the early part of the trading action on Friday and pushed the while metal towards the top end of a short-term descending channel. The XAG/USD was last seen trading around the $25.20 region, up 0.70% for the day.
Meanwhile, technical indicators on the 1-hourly chart have been gaining positive traction. However, bearish oscillators on 4-hourly/daily charts warrant some caution before positioning for any strong follow-through positive move.
Hence, any subsequent positive move is more likely to confront stiff resistance near the $25.35-40 supply zone. A sustained move beyond will mark a bullish breakout and prompt some aggressive short-covering move around the XAG/USD.
The commodity might then aim back to reclaim the $26.00 mark. The momentum could further get extended and push the commodity back towards the $26.40-50 supply zone, tested in the aftermath of the dovish FOMC statement last week.
On the flip side, the key $25.00 psychological mark now seems to protect the immediate downside. Failure to defend the mentioned support will shift the bias back in favour of bearish traders and turn the XAg/USD vulnerable.
The next relevant target on the downside is pegged near the $24.65 region (200-DMA), below which the XAG/USD could accelerate the fall towards challenging YTD lows, around the $24.00 mark touched on January 18.
XAG/USD 4-hourly chart
Technical levels to watch
