- Bulls eye inverse head-and-shoulders breakout on 1H chart.
- S&P 500 futures buoyed by US fiscal stimulus hopes
- 200-HMA could caps gains despite bullish hourly RSI.
S&P 500 futures look to extend the bounce in the US session ahead, helped by the risk-on market mood amid signs of progress in the US fiscal stimulus talks and upbeat earnings reports from the Euro area.
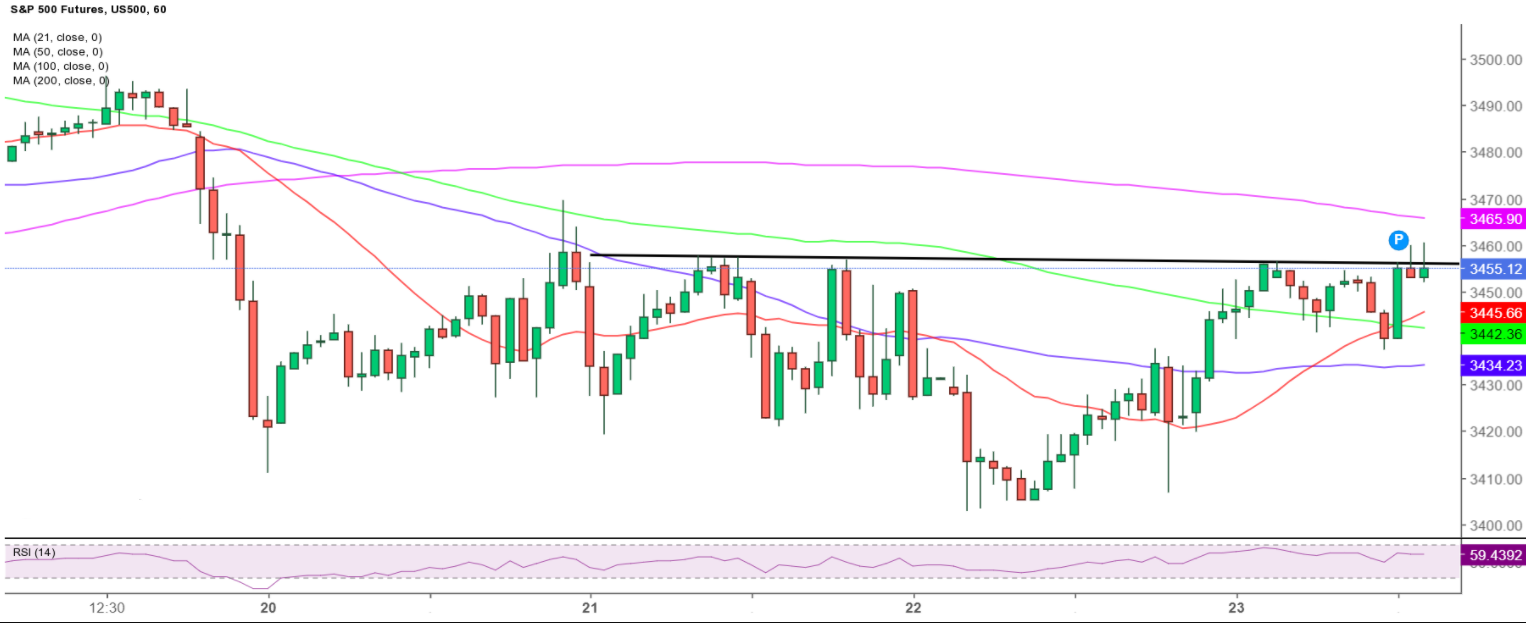
Besides, the technical outlook also appears constructive in the near-term, with the futures tied to the US stocks on the verge of an inverse head-and-shoulder pattern breakout on the hourly sticks.
The bullish breakout will get confirmed on an hourly closing above the neckline resistance, now placed at 3,456.
Acceptance above the latter would expose the next critical resistance at 3,466, which is the horizontal 200-hourly moving average (HMA).
Further north, the bulls could challenge the 3,500 psychological level.
The hourly Relative Strength Index (RSI) remains in the bullish region, around 60.50, supporting the upside bias.
On the flip side, the confluence of the upward-sloping 21-HMA and bearish 100-HMA around 3,445 could offer immediate support.
Sellers would then target the horizontal 50-HMA at 3,434 if the downside momentum intensifies.
S&P 500 Futures: Hourly chart