- S&P 500 bullish recovery from mid-March remains intact.
- The level to beat for bulls is the 2900 resistance.
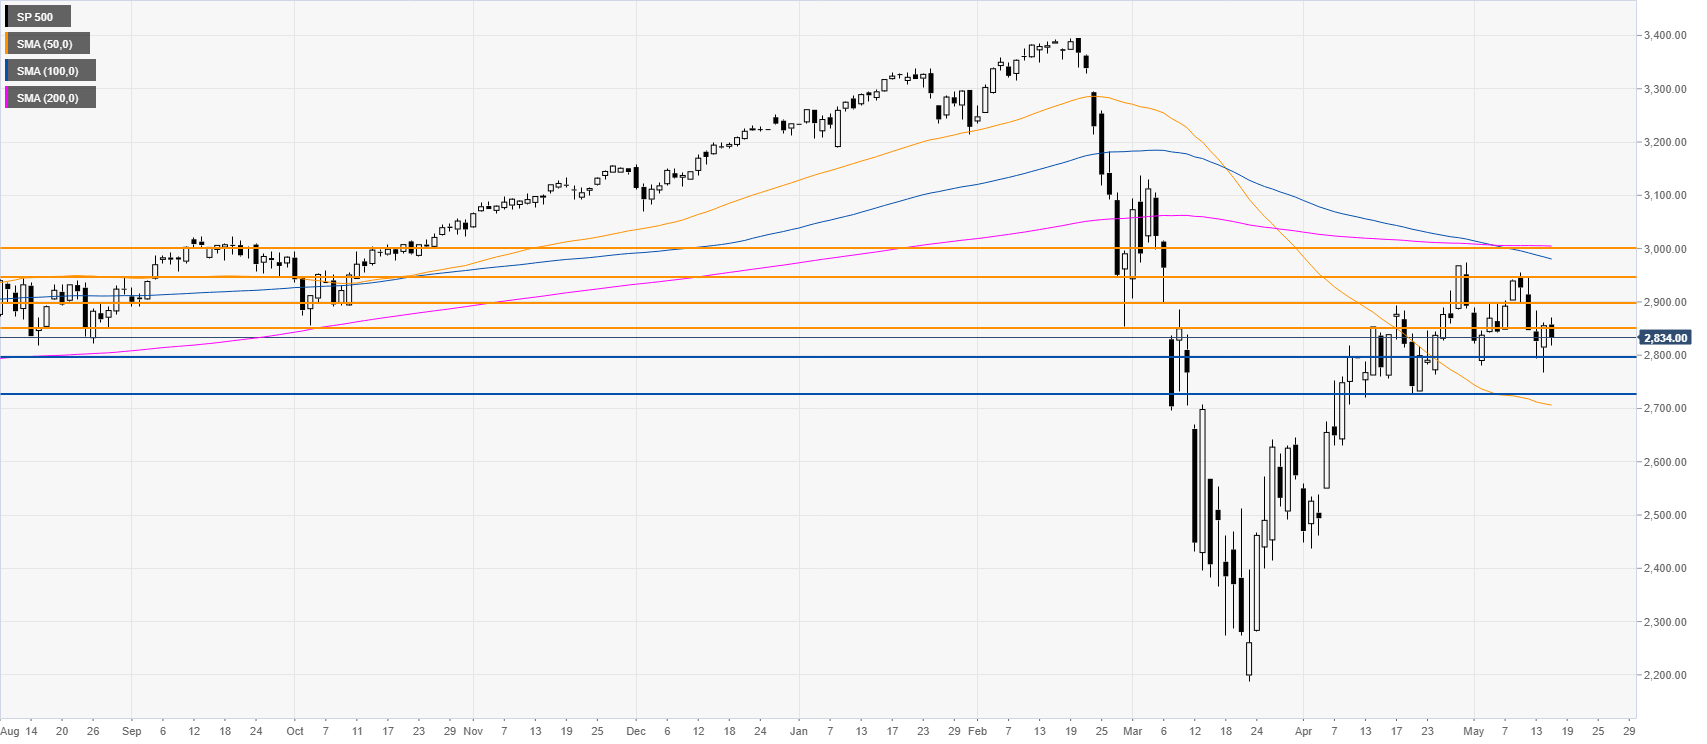
S&P 500 daily chart
Following the February-March crash, the S&P 500 has been recovering sharply. The market consolidates the advance and bounces from the 2800 level while trading above the 50 SMA on the daily chart. Bulls stay in full control of the S&P 500 with the idea of regaining the 2900 resistance en route towards the 2950 level and the 3000 round figure near the 100 and 200 SMAs. On the flip side, support can be seen near 2855 and 2800 levels.
Additional key levels
