- S&P 500 unsurprisingly gives up recent gains as traders wait for Fed day.
- Will the Fed hint at tapering or even stronger measures?
- Investors once again growing wary of bubbles and inflation.
The calm slide on Tuesday was no surprise given risk-off always dominates ahead of any Federal Reserve meeting and this one was no different. Perhaps even heightened by the record highs set on Monday as profits were booked and banked.
S&P 500 (ES) technical analysis
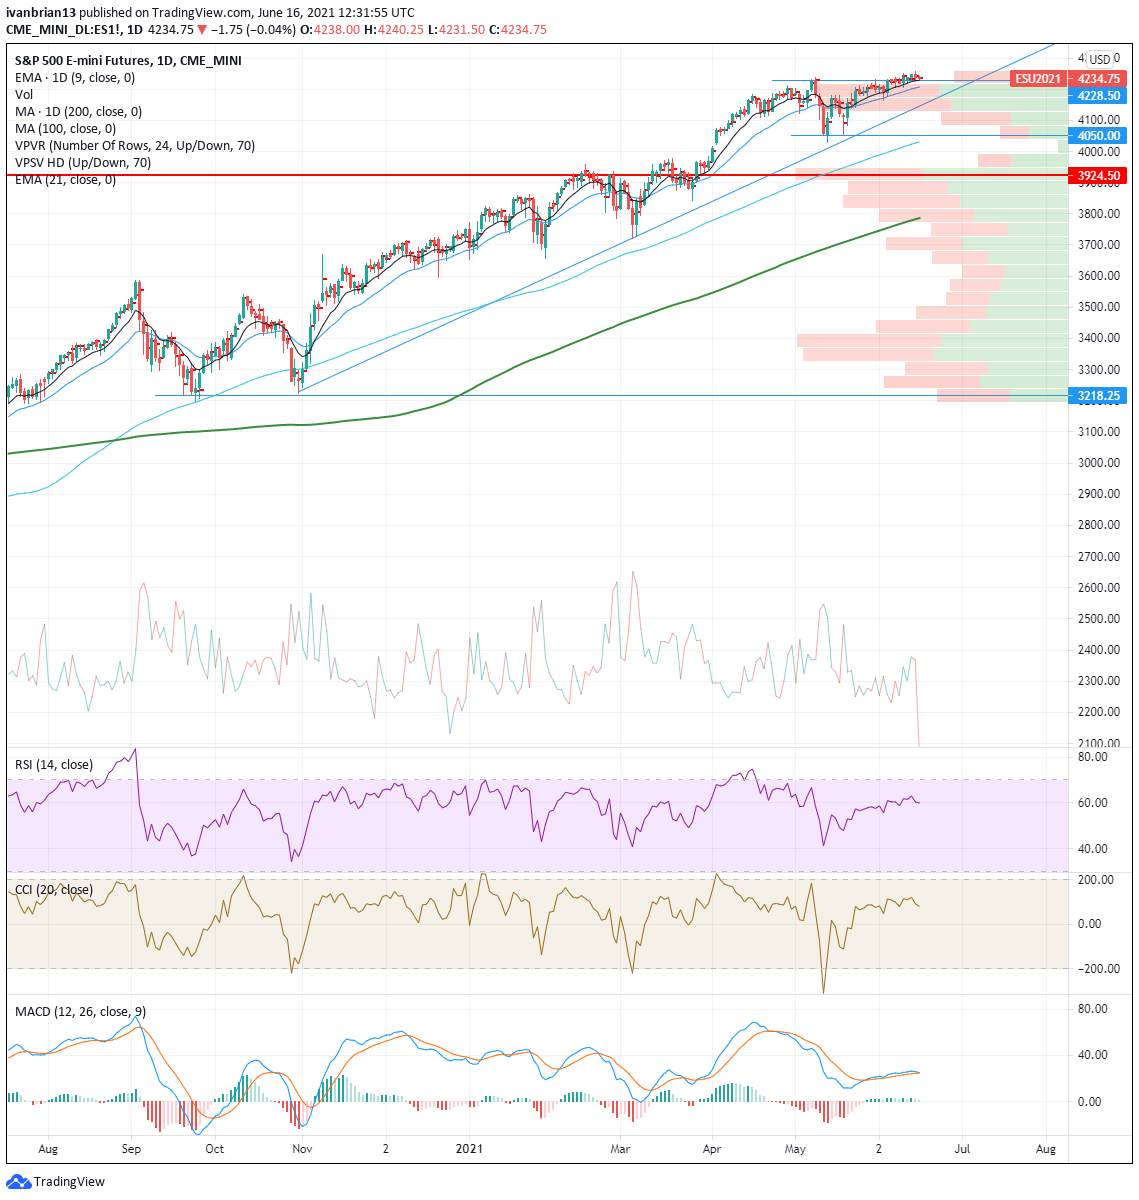
Using the futures contract (ES) for analysis as it and the SPY represent the two ways to trade the S&P 500 index. Stepping back and taking the long view there has really only one way to play this move, long long long. Bears have been battered since March 2020. Despite record highs set as recently as two days ago, bears are beginning to see some hope in the notion of a Fed taper. Either way, the strong double bottom from mid-May kicked off this recent push to record highs, and that 4,050 remains a key level. Volume completely diminishes below this level so a break will likely accelerate to sub 4,000 pretty quickly.
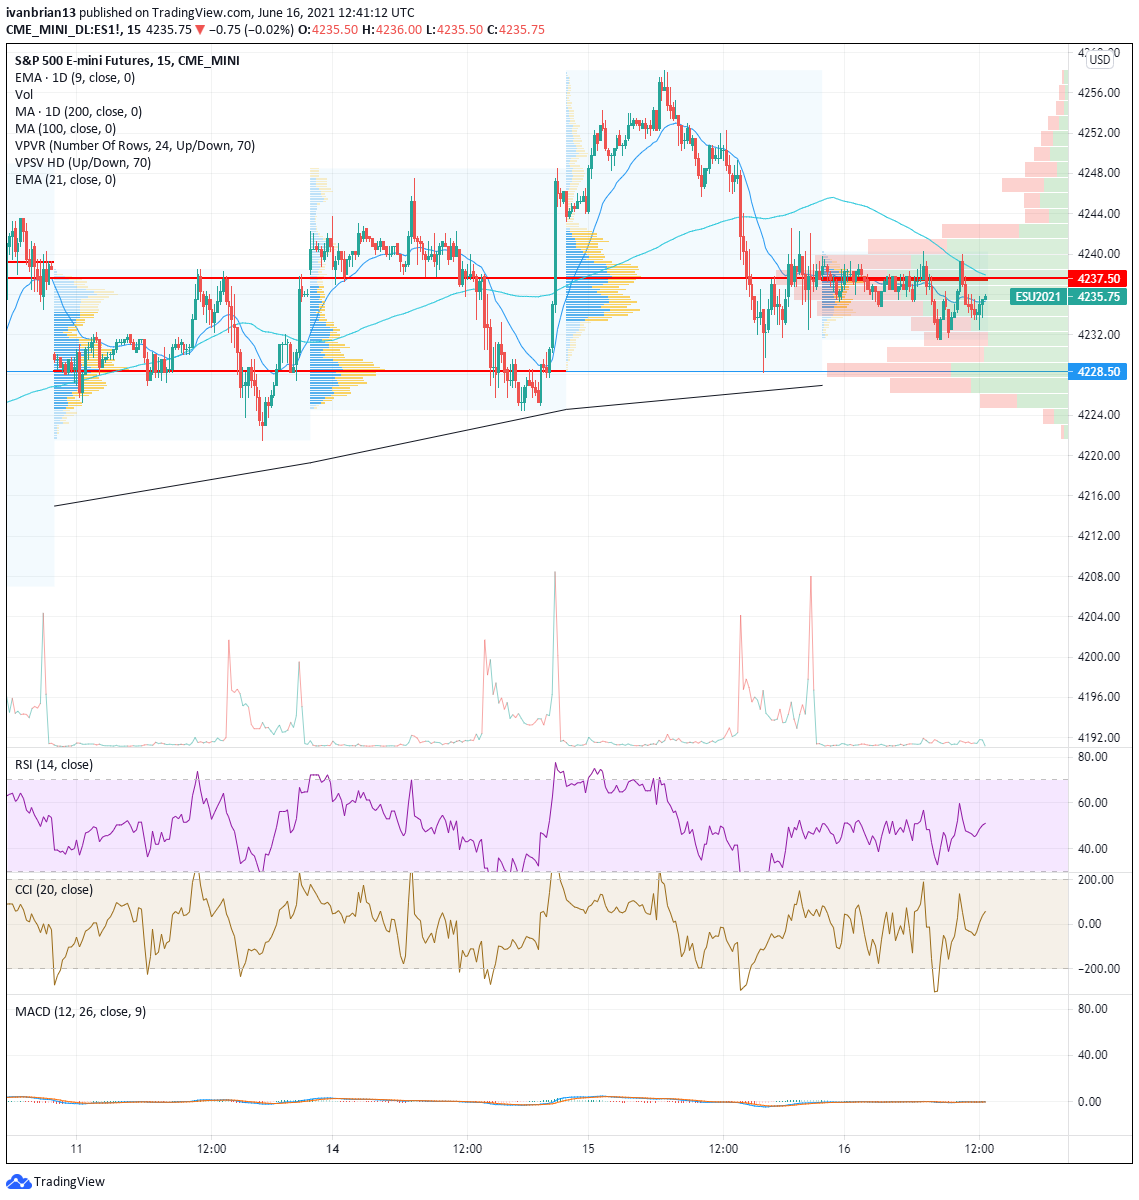
Drilling down to the intraday, fifteen-minute chart gives us a clearer picture of the indecision as markets await Fed guidance. Monday 14th saw the market open toward the high of the daily range as excitement overtook traders. But the volume profile in the intraday chart (blue/yellow volume bars) showed this move to be unsustainable with a low volume opening. The S&P retreated to find strong support at the lower end of the range 4228, which is where Friday’s volume was also the greatest. This support zone allowed the late surge and a set up to new highs on Tuesday but again the early surge on Wednesday morning (US overnight) saw a total lack of volume and volume means validation of price. So the lack of confirmatory volume resulted in the slip back to this region of high volume at 4237, the recent point of control. 4,228 is the first strong support should the market wobble on the Fed meeting. This is also the 9-day moving average, reinforcing the importance of the level. A break will see a steady move through heavy traffic in the 4,200 to 4,160 zone with 4,160 being the lower trendline.