- The S&P500 makes no progress this Thursday as it consolidates Wednesday’s losses.
- The market might continue declining towards the 2,814.00 and 2,790.00 levels.
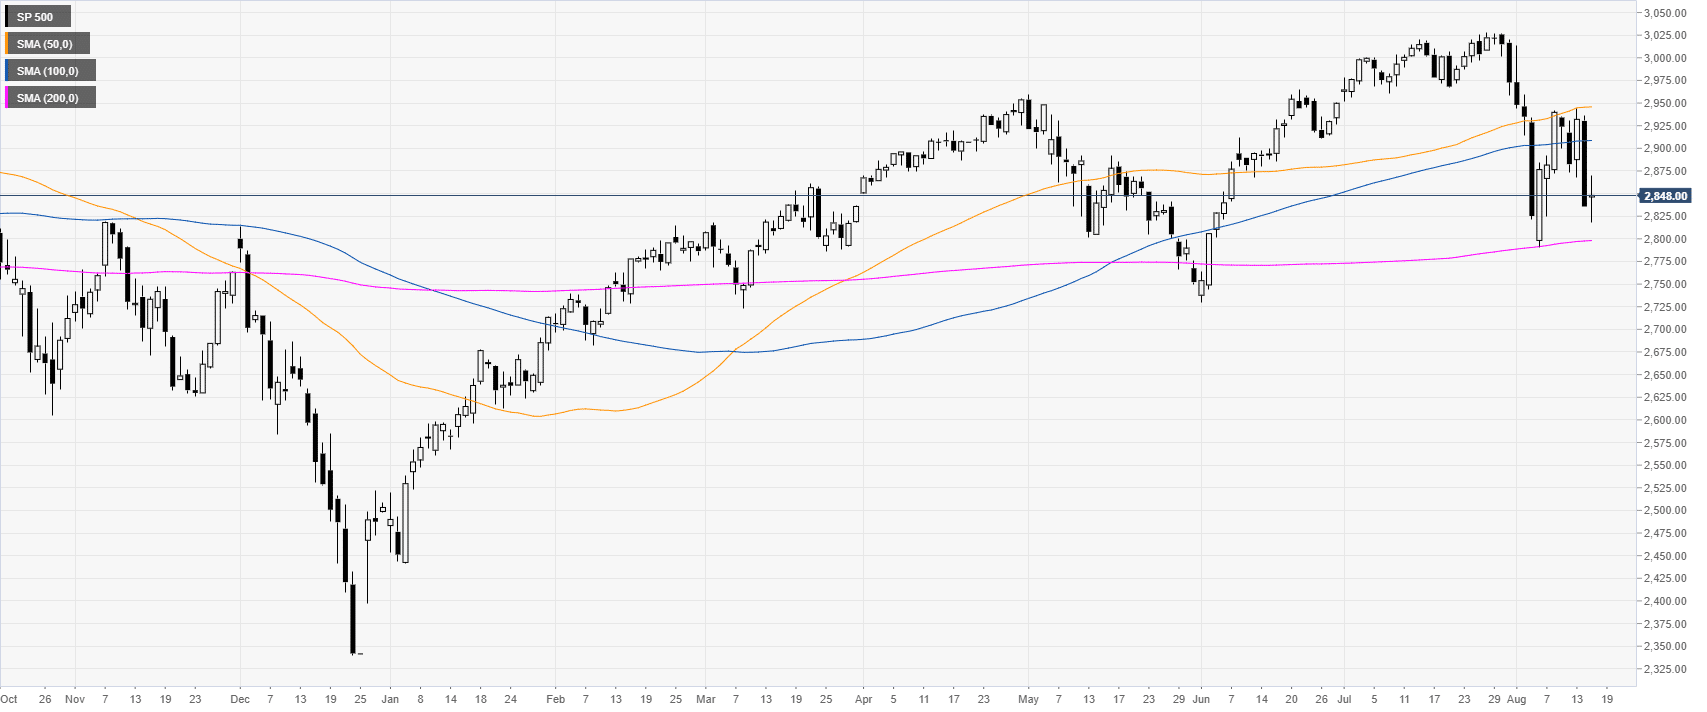
S&P500 daily chart
The S&P 500 Index is trading below the 2,900.00 handle and the 50/100 day simple moving averages (DSMAs) as the yield curve inversion is seen as a recession signal by market players.
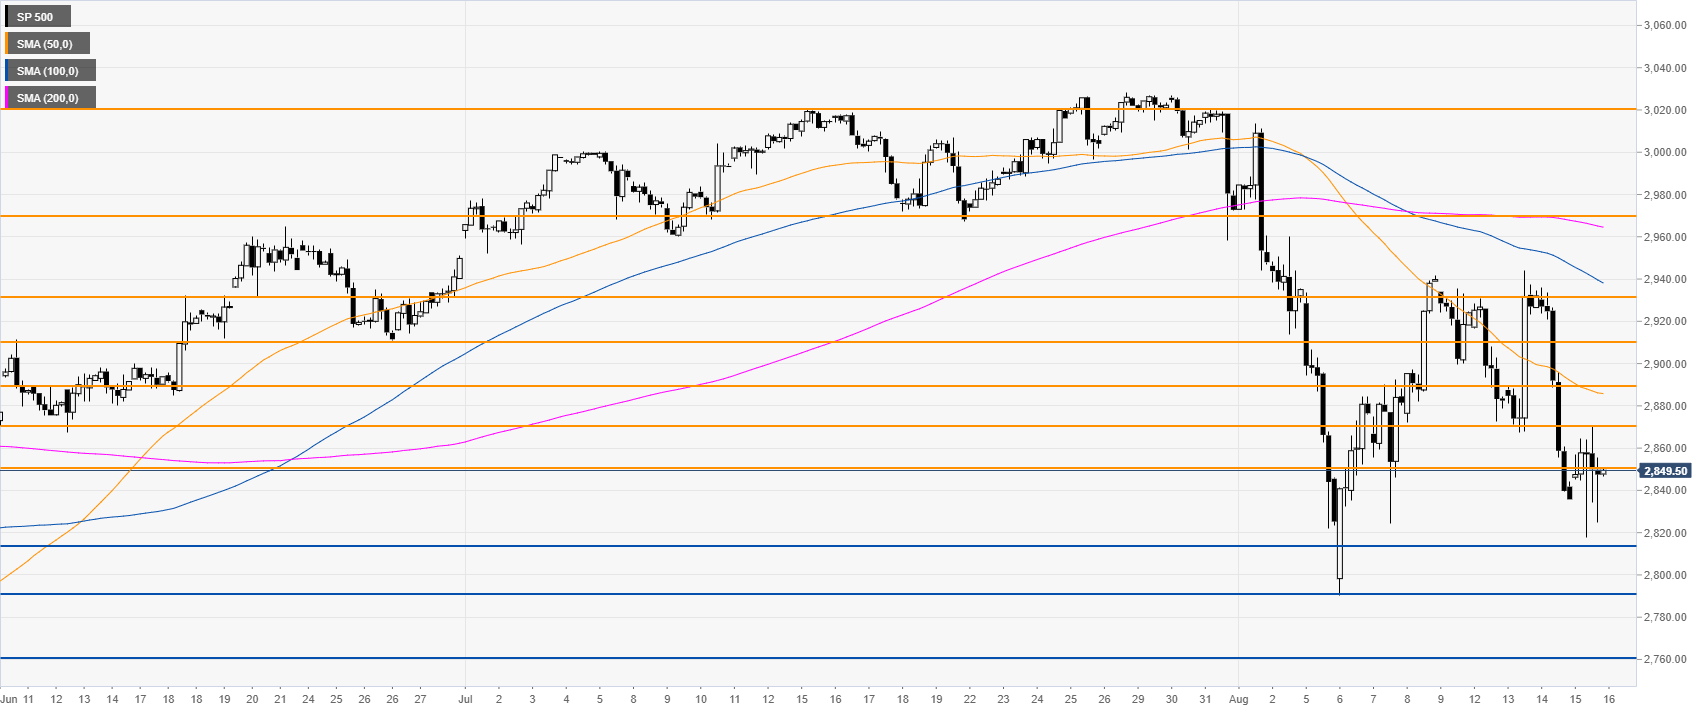
S&P500 4-hour chart
The market has been consolidating around the 2,850.00 level this Thursday. It seems the bears could drive the market lower towards 2,814.00 and 2,790.00 support in the medium term. The 2,850/70 levels could act as resistance.
Additional key levels
