- The S&P 500 pull back down is extending further.
- The S&P 500 is challenging the 200-day simple moving average, (DMA).
- Coronavirus fear is taking its toll on global markets.
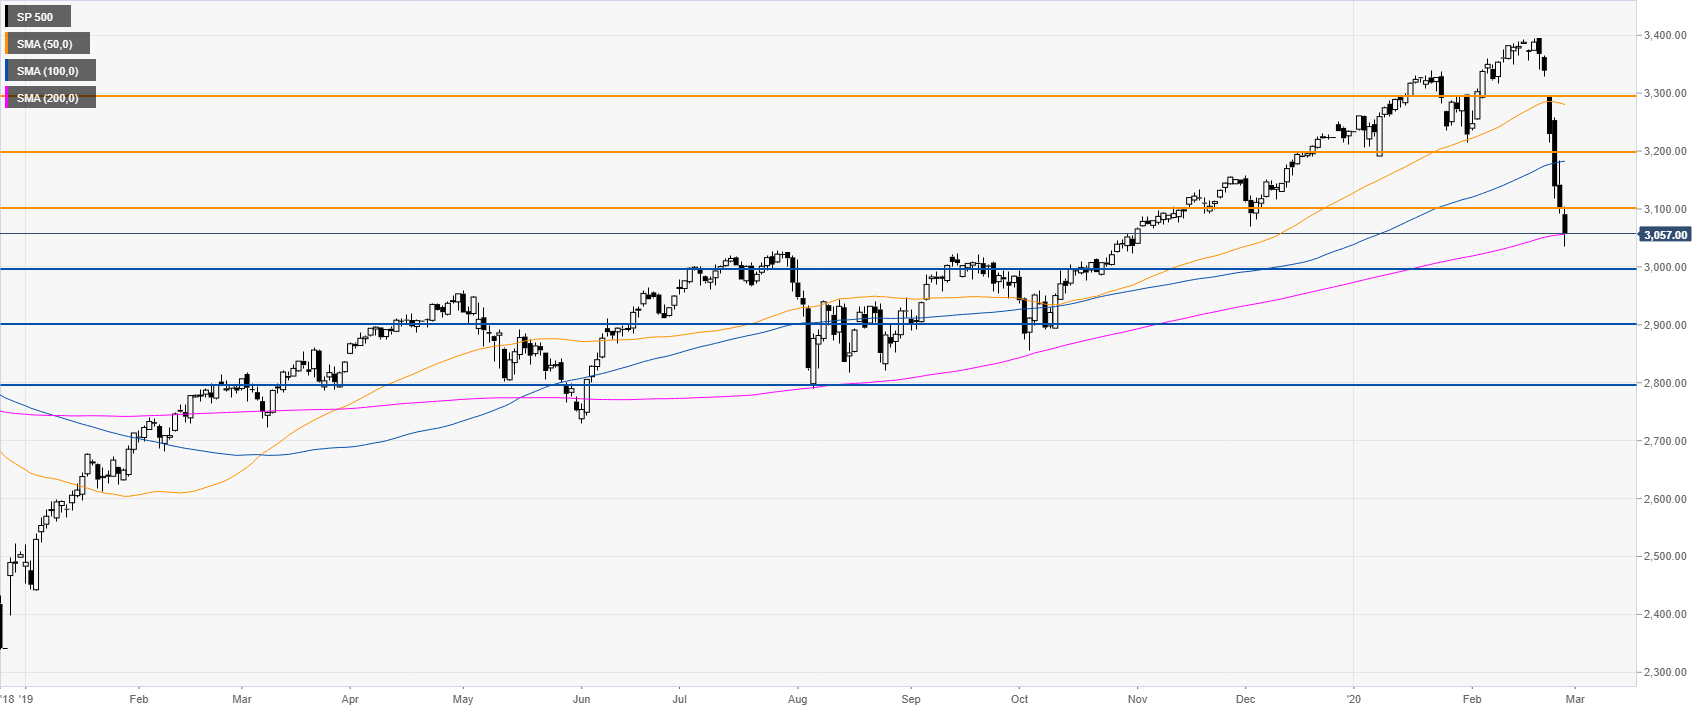
S&P 500 daily chart
The S&P 500 Index is having a deep retracement down now challenging the 200-day simple moving average (DMA) as bears broke below the 3100 figure while at fresh 2020 lows. The spread of the Coronavirus is sending traders into panic. The break below the above-mentioned level could to further selling with an extension down towards the 3000 figure and the 2900 level.
Additional key levels
