Home S&P500 tecchnical analysis: US stocks ends Tuesday in the red below 3,010.00 resistance
FXStreet News

S&P500 tecchnical analysis: US stocks ends Tuesday in the red below 3,010.00 resistance

  • The S&P500 Index is retreating below the 3,010.00 resistance.
  • Supports can be seen near the 2,985.00 and 2,965.00 levels.
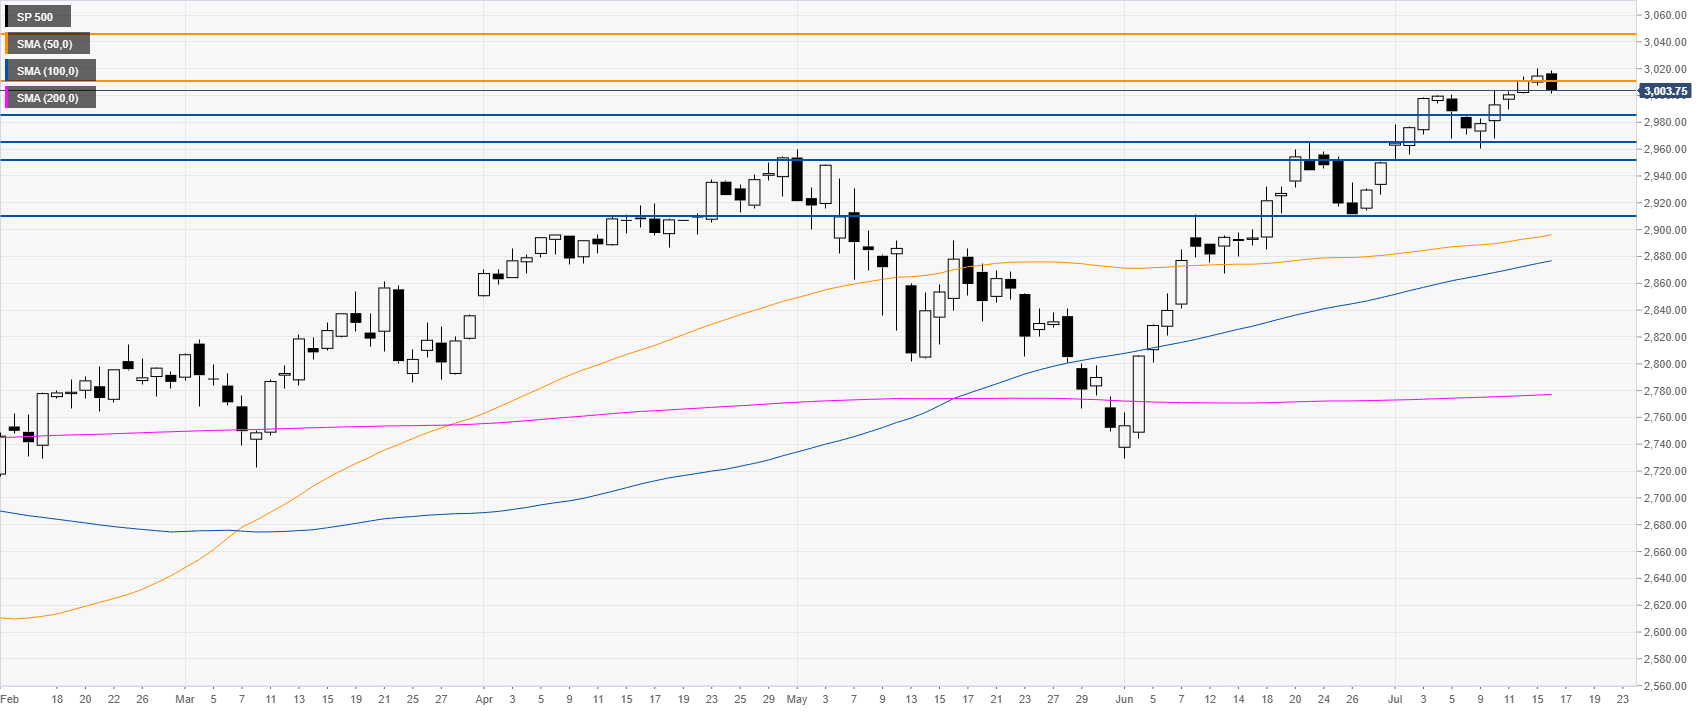
 

S&P500 daily chart

The S&P500 is trading in a bull trend above its main SMAs. The market is retrearting below the 3,010.00 level.  
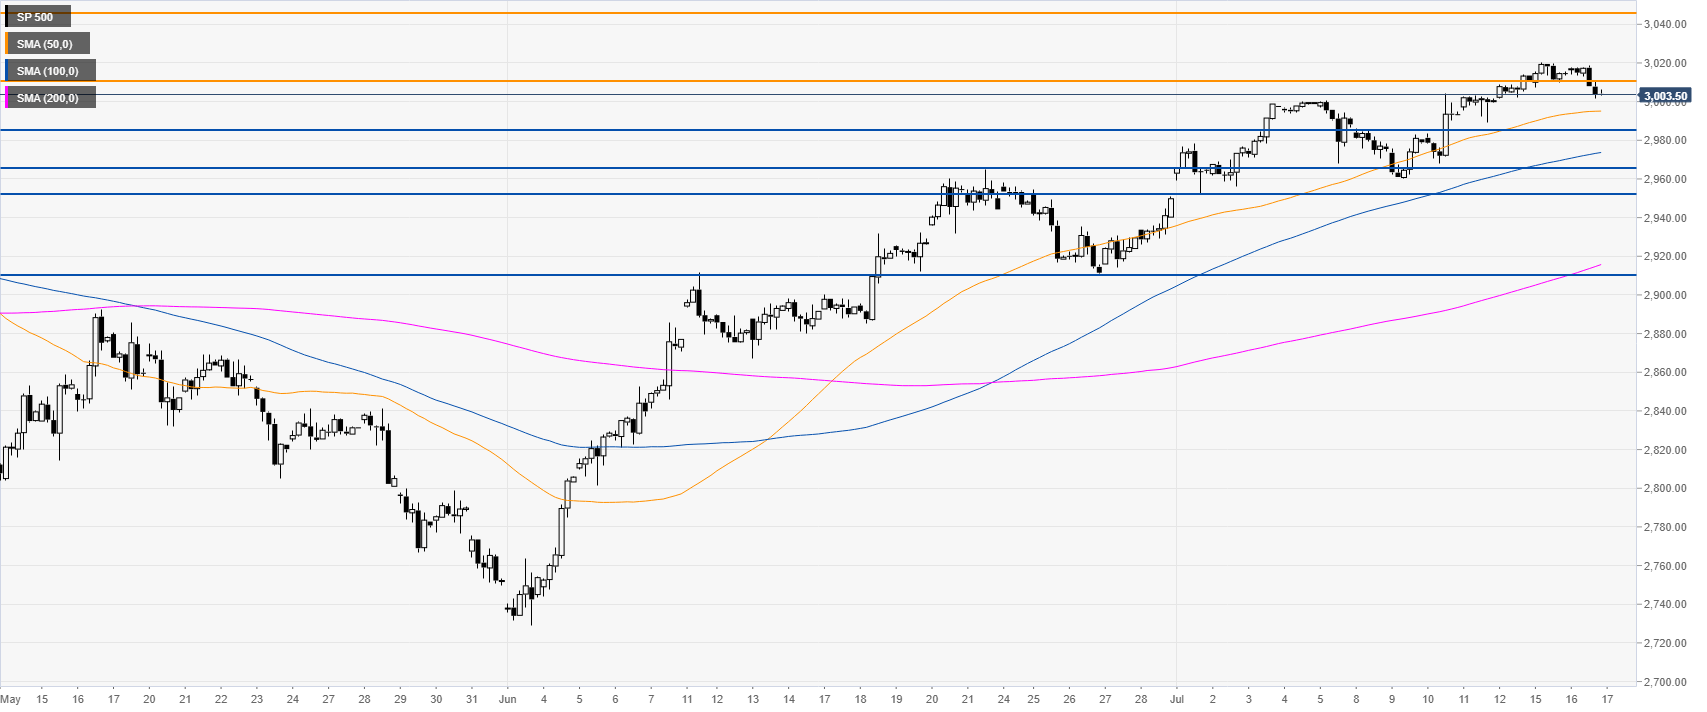
S&P500 4-hour chart

The market is correcting down. If bears get enough strength they could dricve the market to the 2,985.00 level. If that level fails to hold prices, further down lies the 2,965.00 level.

Additional key levels


FX Street

FX Street

FXStreet is the leading independent portal dedicated to the Foreign Exchange (Forex) market. It was launched in 2000 and the portal has always been proud of their unyielding commitment to provide objective and unbiased information, to enable their users to take better and more confident decisions.