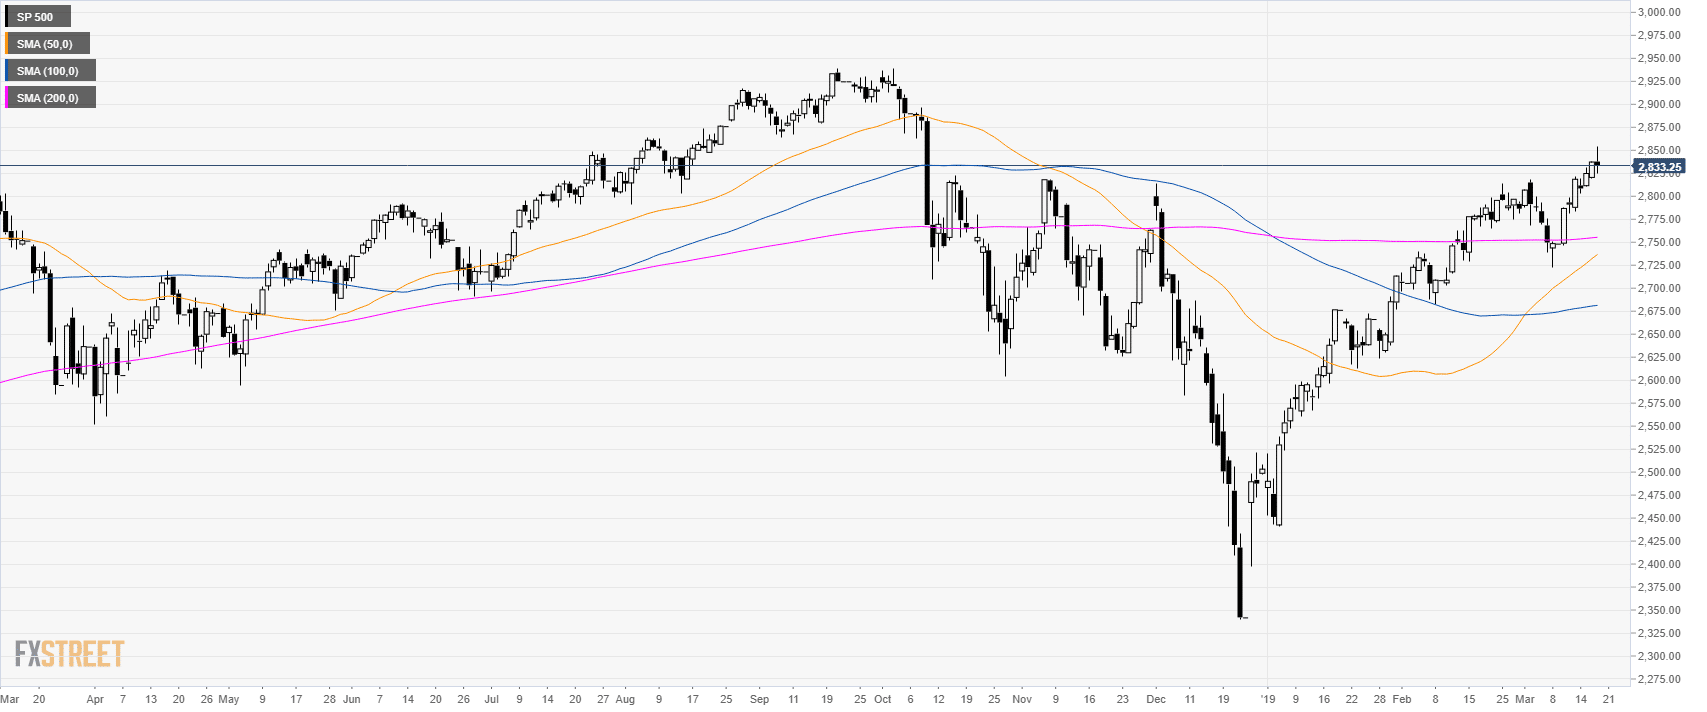
S&P500 daily chart
- The S&P500 is trading above its main simple moving average suggesting bullish momentum.
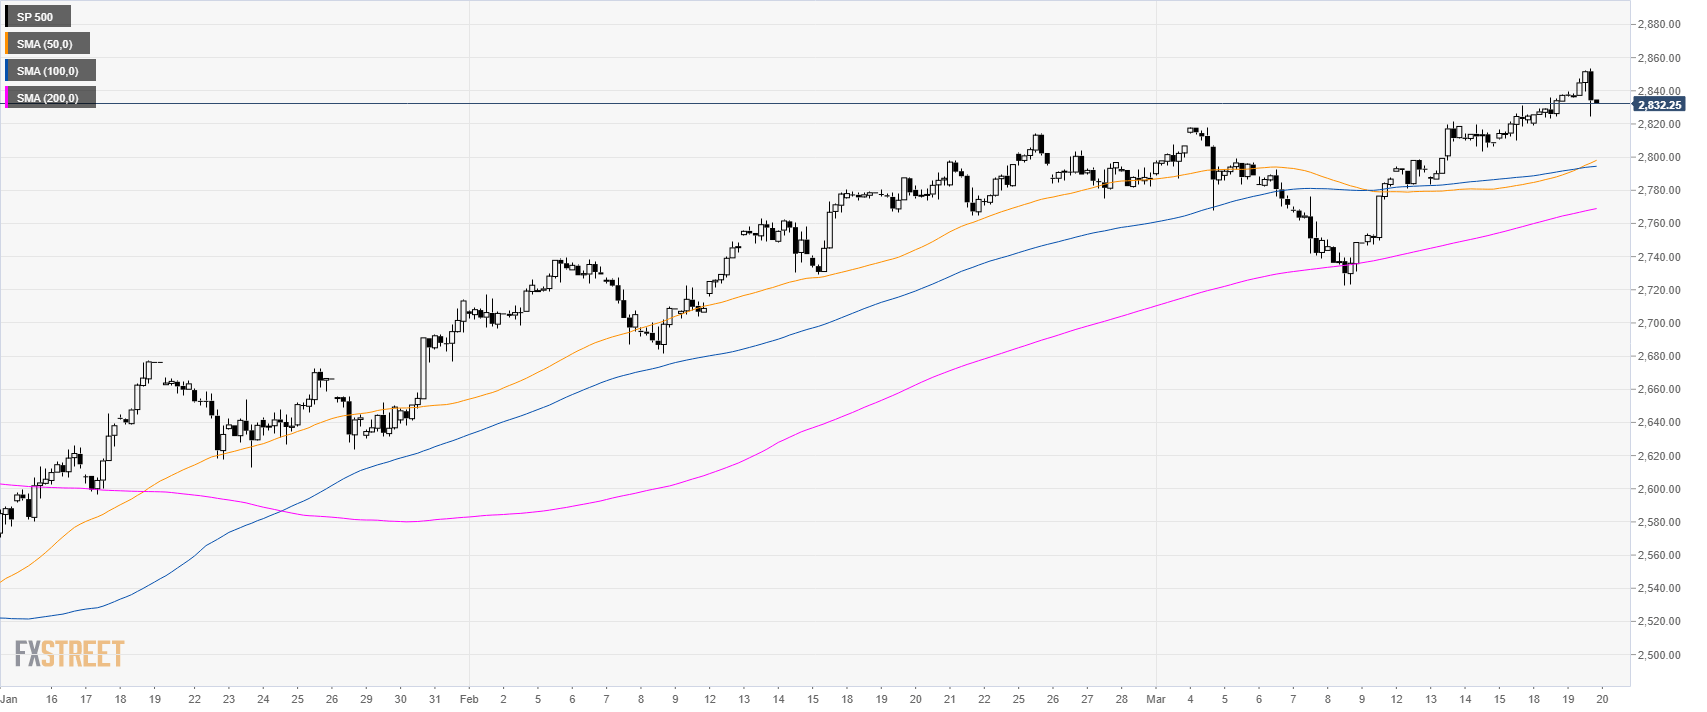
S&P500 4-hour chart
- The S&P500 is trading above its main SMAs suggesting bullish momentum in the medium-term.
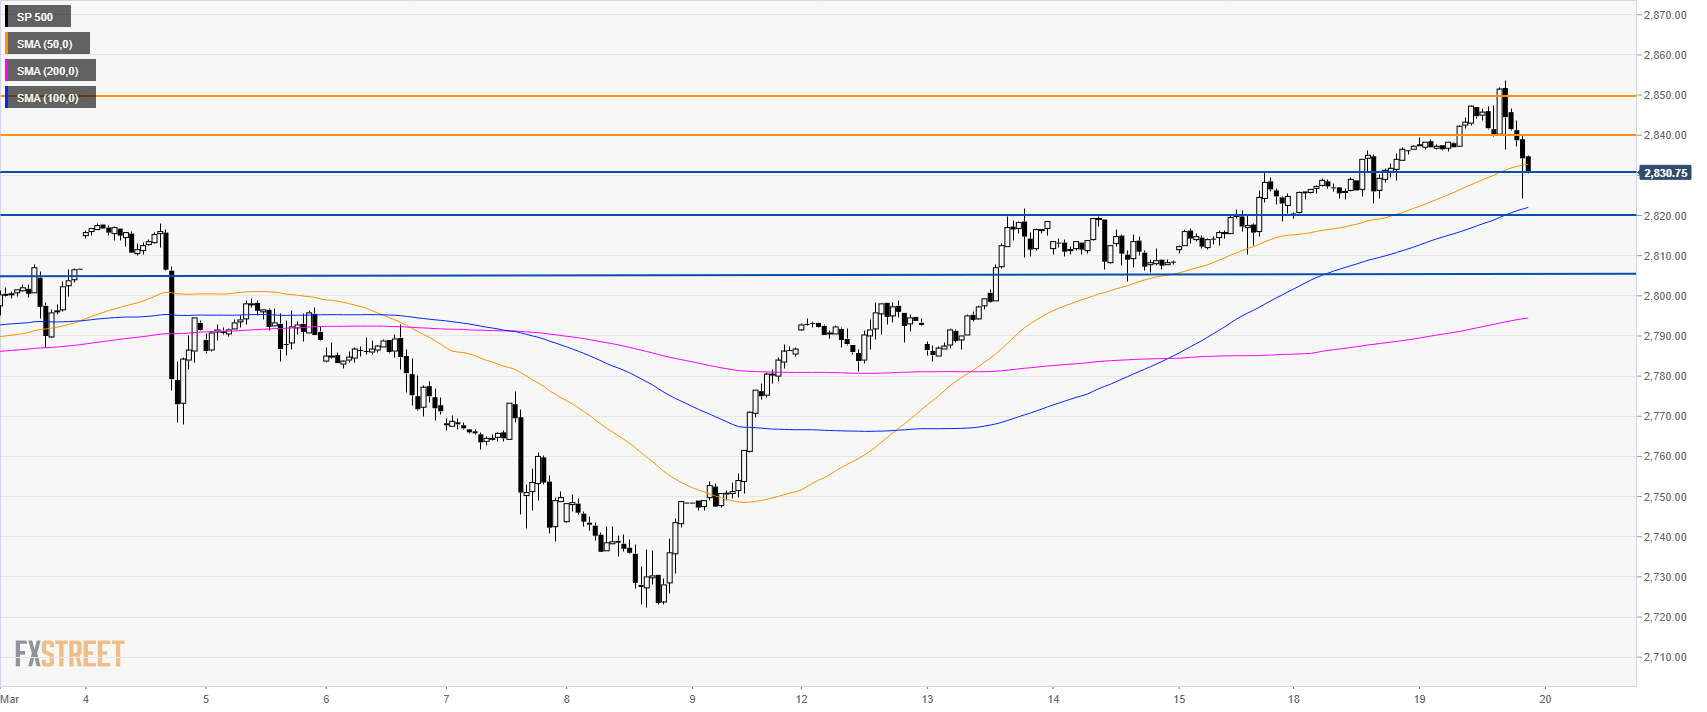
S&P500 60-minute chart
- The S&P500 is trading above the 100 and 200 SMAs suggesting bullish momentum in the short-term.
- A break below 2,830.00 support can lead to 2,820.00 and 2,805 support.
- Resistances are at 2,840.00 and 2,850.00 level.
Additional key levels
SP 500
Overview:
Today Last Price: 2834.25
Today Daily change %: -0.11%
Today Daily Open: 2837.25
Trends:
Daily SMA20: 2789.99
Daily SMA50: 2732.14
Daily SMA100: 2680.63
Daily SMA200: 2754.8
Levels:
Previous Daily High: 2837.5
Previous Daily Low: 2819.25
Previous Weekly High: 2831
Previous Weekly Low: 2746.5
Previous Monthly High: 2814.25
Previous Monthly Low: 2681.75
Daily Fibonacci 38.2%: 2830.53
Daily Fibonacci 61.8%: 2826.22
Daily Pivot Point S1: 2825.17
Daily Pivot Point S2: 2813.08
Daily Pivot Point S3: 2806.92
Daily Pivot Point R1: 2843.42
Daily Pivot Point R2: 2849.58
Daily Pivot Point R3: 2861.67
