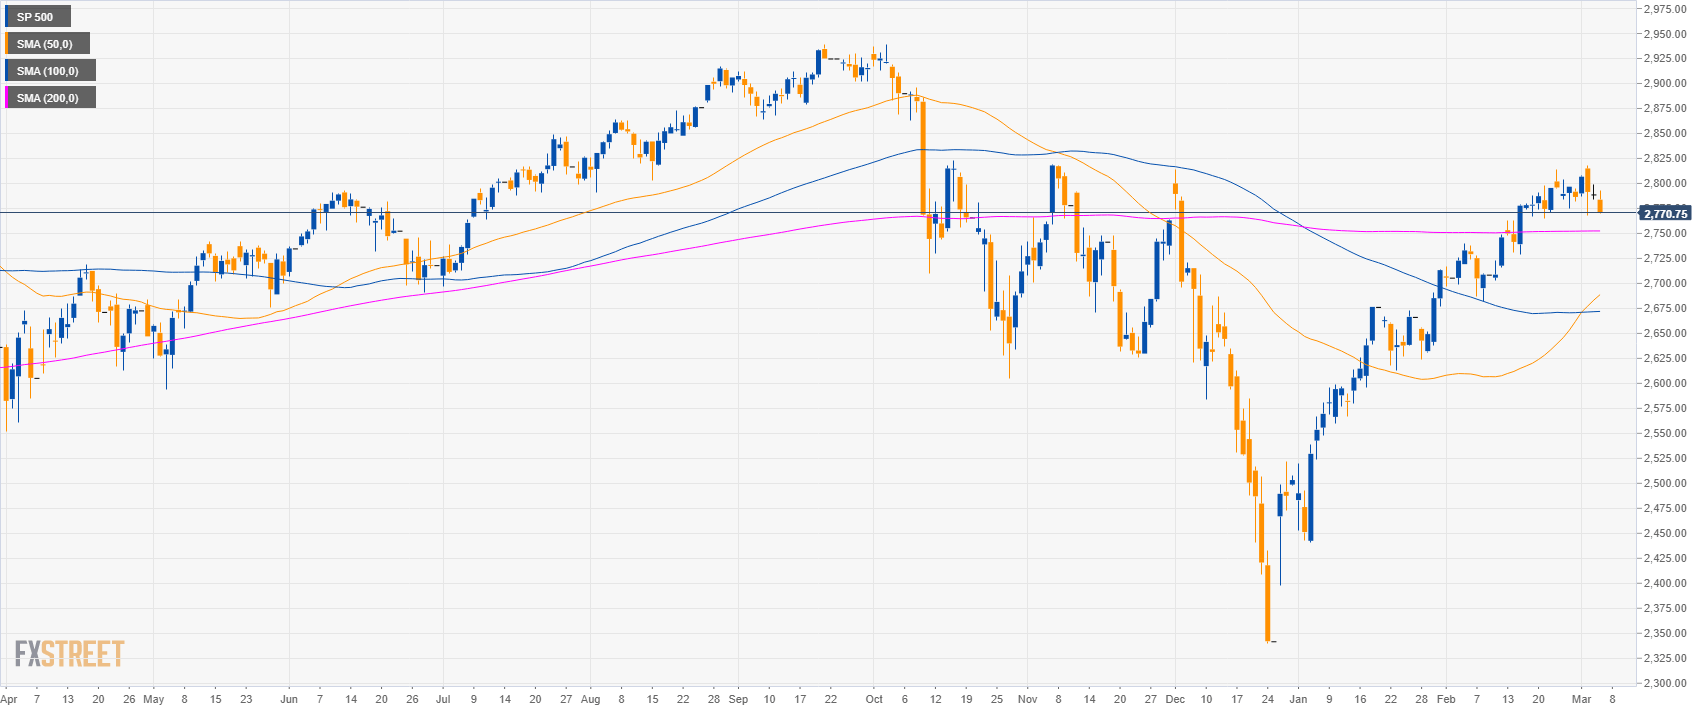
S&P500 daily chart
- The S&P500 is trading in a bull leg above the 200-day simple moving averages (SMA).
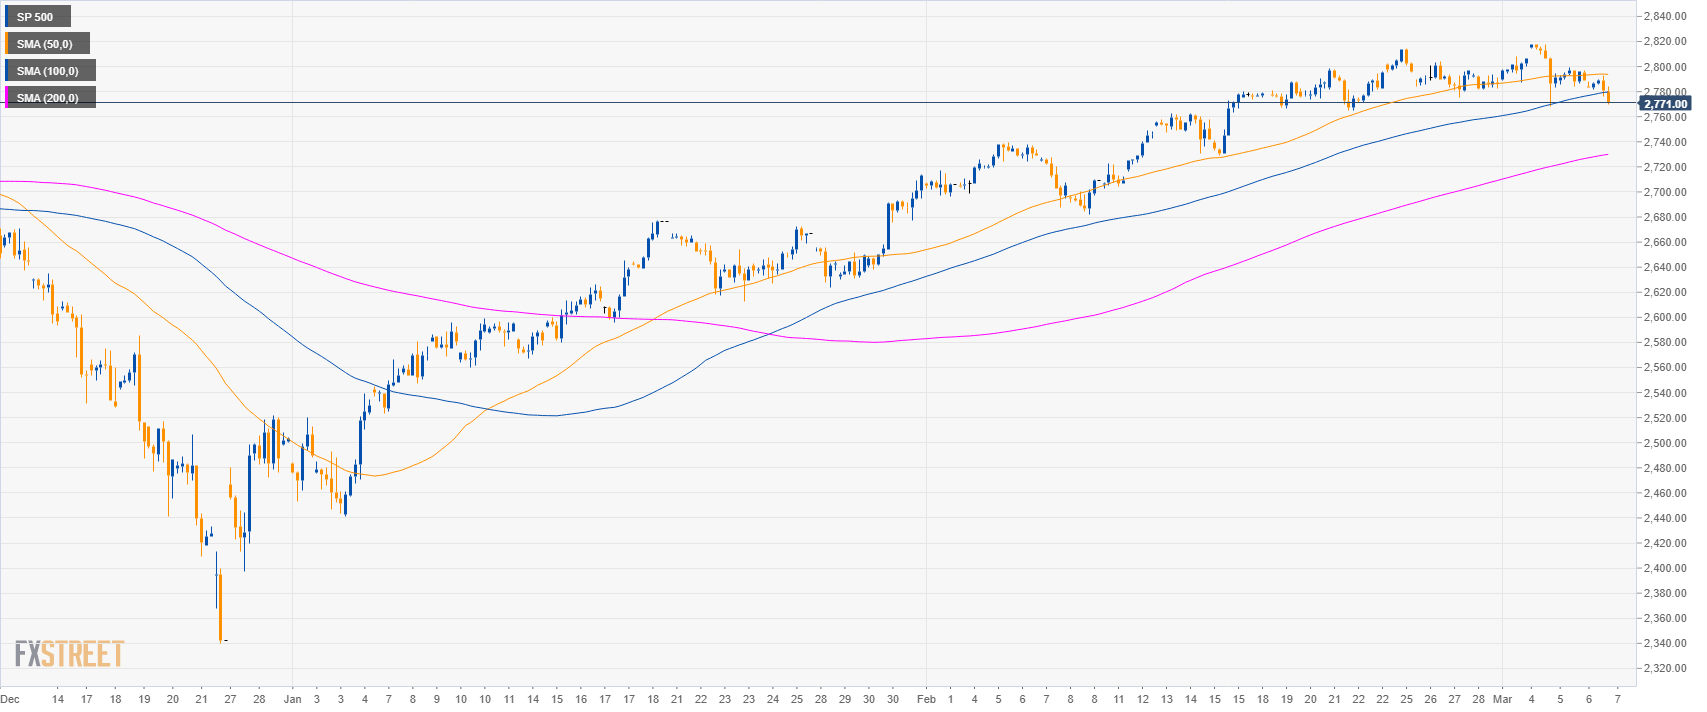
S&P500 4-hour chart
- The market is trading below its 100 and 200 SMA suggesting a potential pullback down.
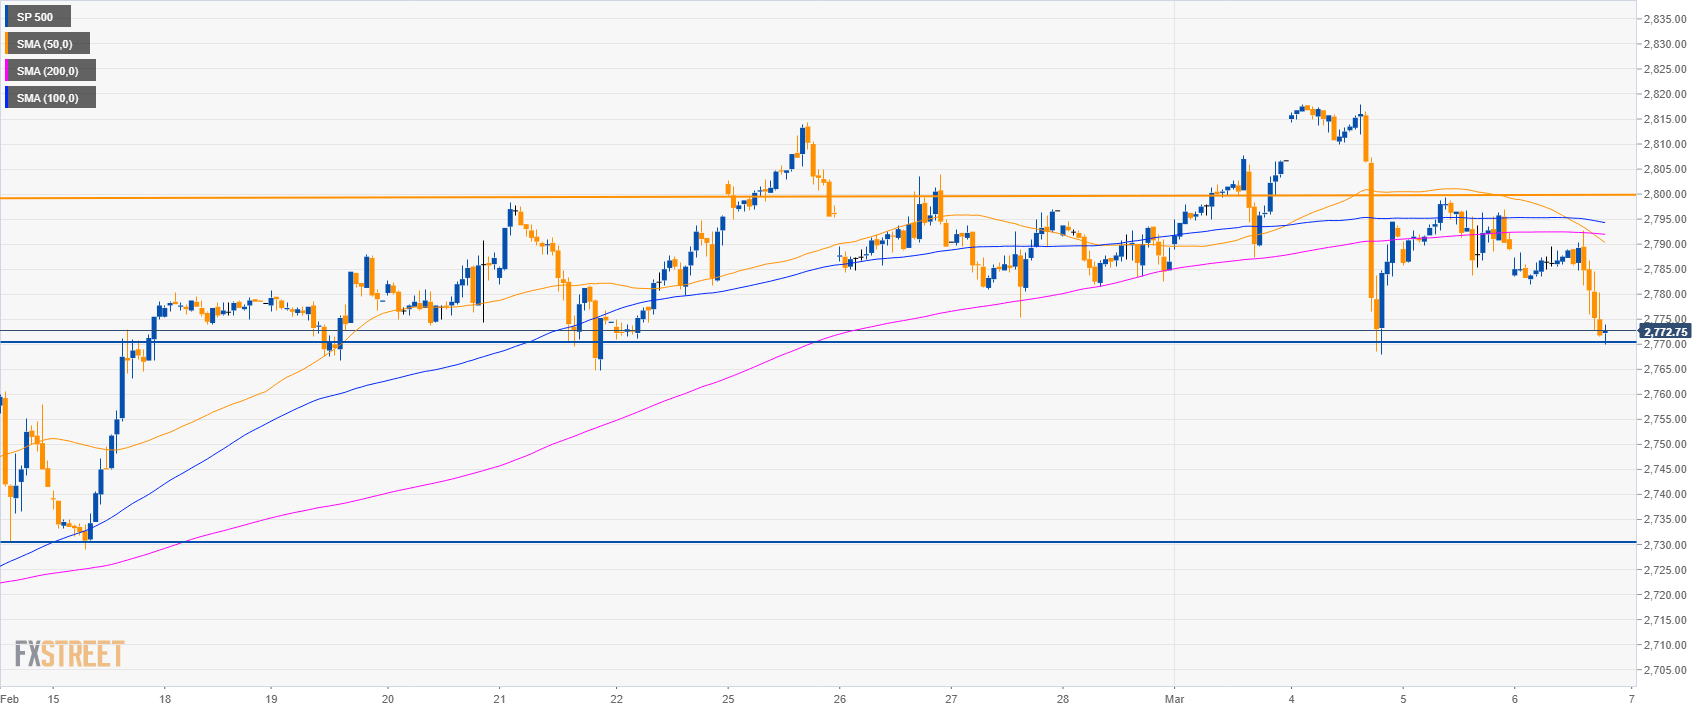
S&P500 60-minute chart
- The S&P500 is trading below its main SMAs suggesting bearish momentum.
- Bears are knocking at the 2,770.00 support. A breach below the level can lead to a drop to 2,730.00 support.
- Resistance is at the 2,800.00 level.
Additional key levels
SP 500
Overview:
Today Last Price: 2771.25
Today Daily change: -17.75 points
Today Daily change %: -0.64%
Today Daily Open: 2789
Trends:
Daily SMA20: 2765.84
Daily SMA50: 2683.38
Daily SMA100: 2671.71
Daily SMA200: 2752.47
Levels:
Previous Daily High: 2799.25
Previous Daily Low: 2783.75
Previous Weekly High: 2814.25
Previous Weekly Low: 2775.25
Previous Monthly High: 2814.25
Previous Monthly Low: 2681.75
Daily Fibonacci 38.2%: 2793.33
Daily Fibonacci 61.8%: 2789.67
Daily Pivot Point S1: 2782.08
Daily Pivot Point S2: 2775.17
Daily Pivot Point S3: 2766.58
Daily Pivot Point R1: 2797.58
Daily Pivot Point R2: 2806.17
Daily Pivot Point R3: 2813.08
