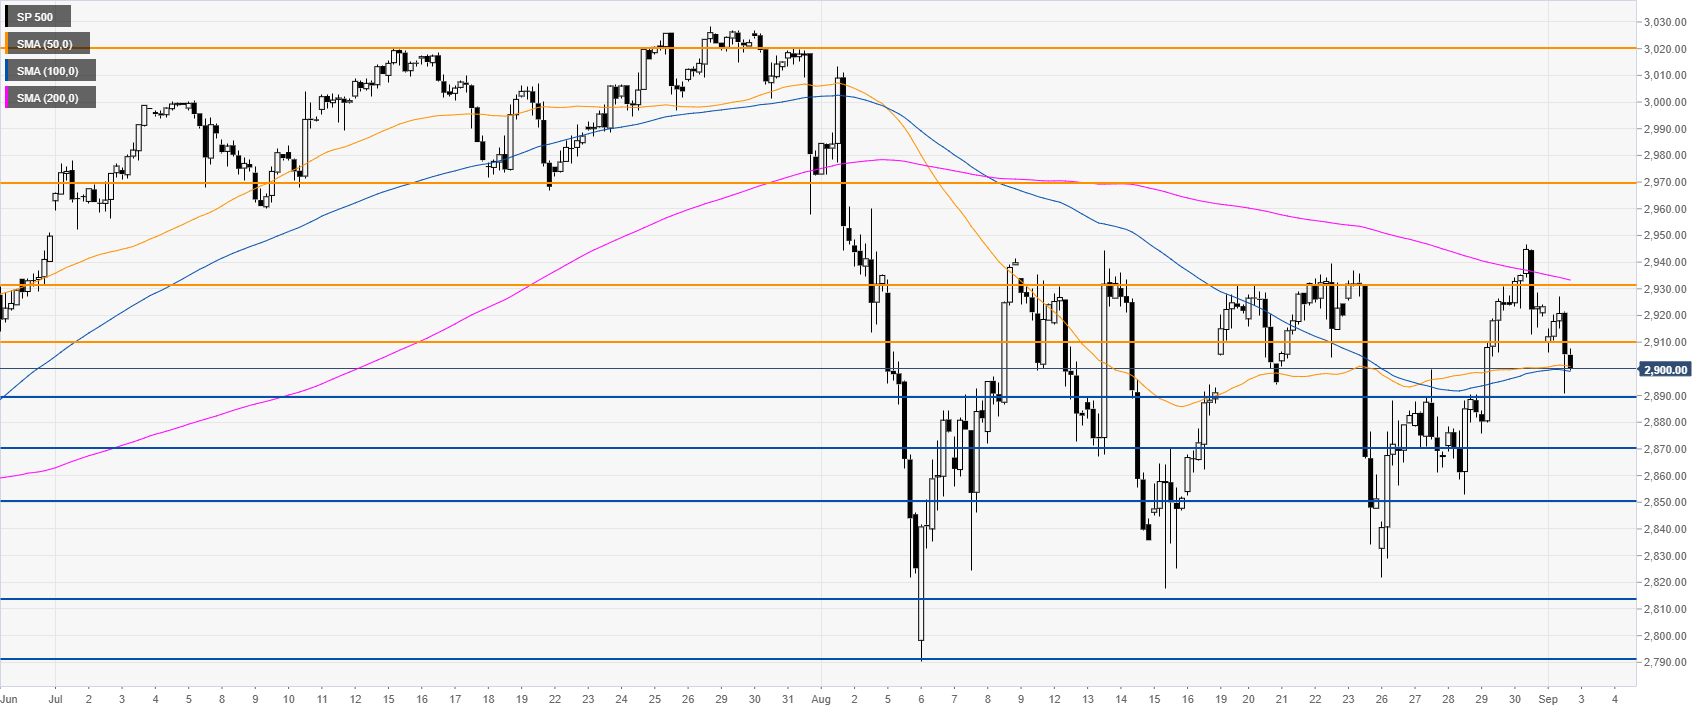
- The S&P500 is starting the week on the back foot, declining below last week’s high.
- The level to beat for bears are at the 2,890 and 2,870 levels.
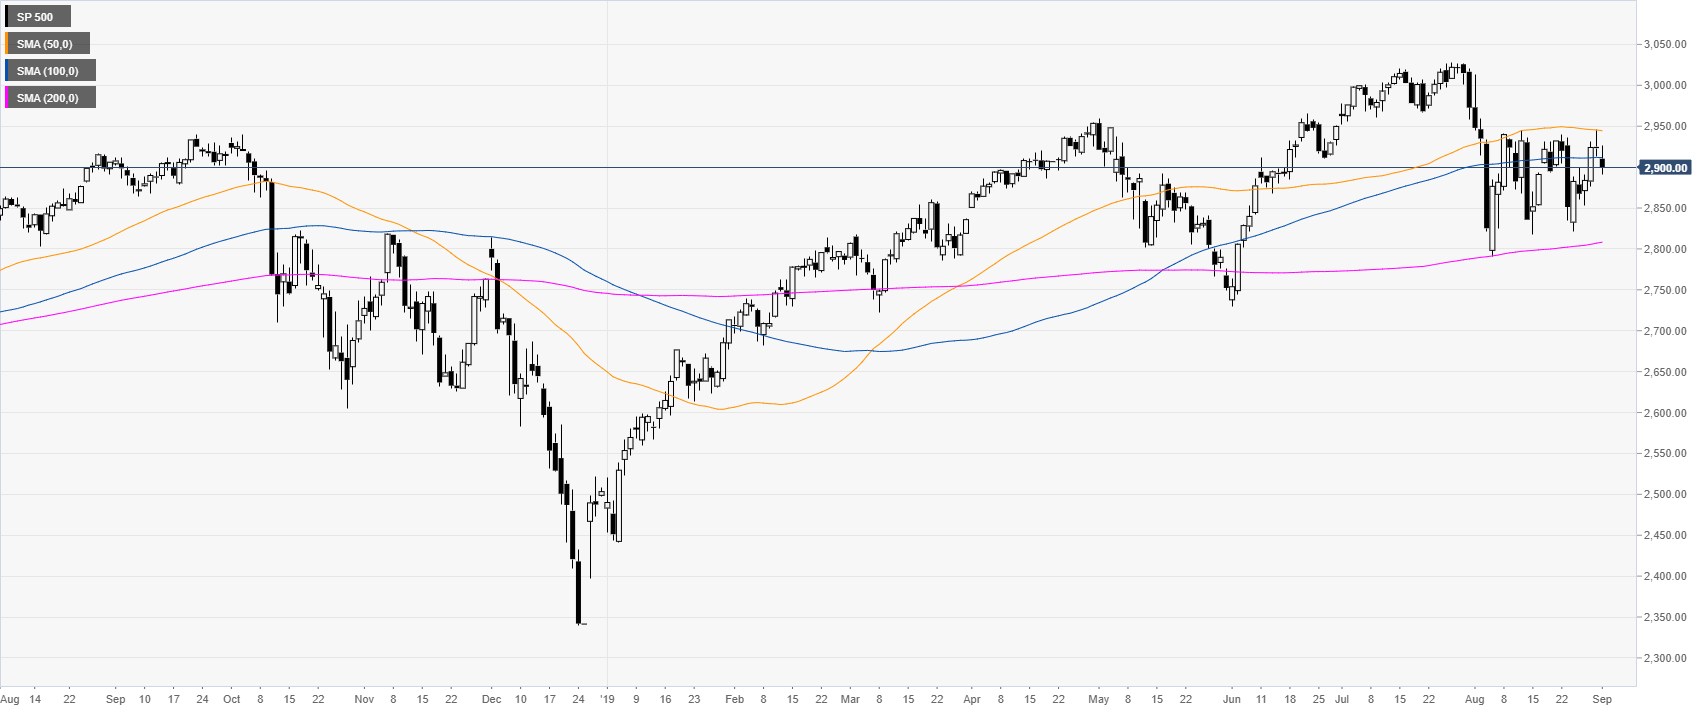
S&P500 daily chart
The S&P 500 Index ended the day just at the 2,900 handle below the 50/100 day simple moving averages (DSMAs) as the market is choppy between the 2,800 and 2,950 levels.
S&P500 4-hour chart
The market is challenging the 2,900 level and the 50/100 SMAs. Bears want a break below 2,890 support to drive the index towards 2,870 and 2,850 support.
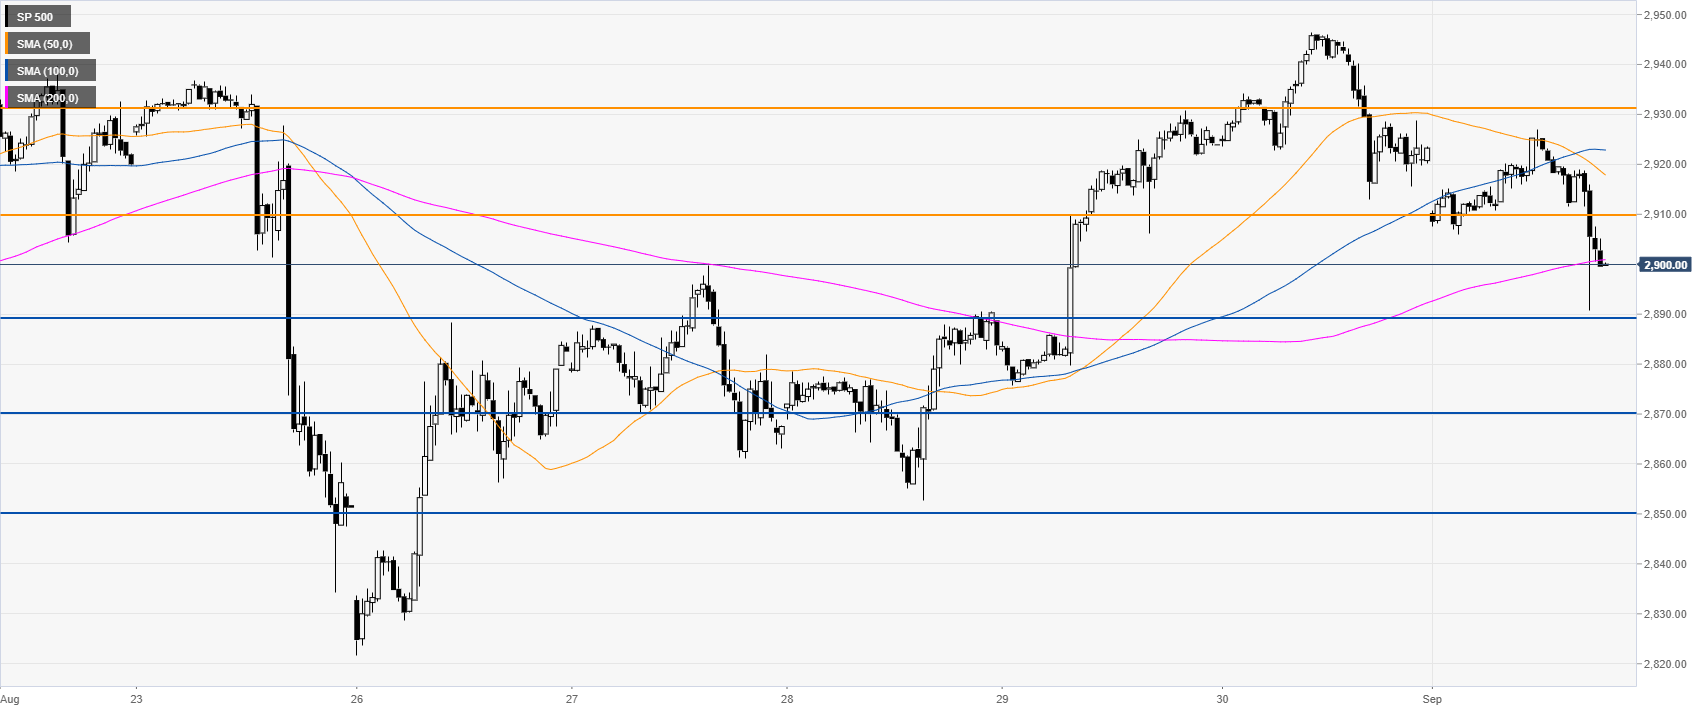
S&P500 4-hour chart
The index is testing the 200 SMA, suggesting a correction down in the near term. Immediate resistances are seen at 2,910 and 2,930 levels.
Additional key levels
