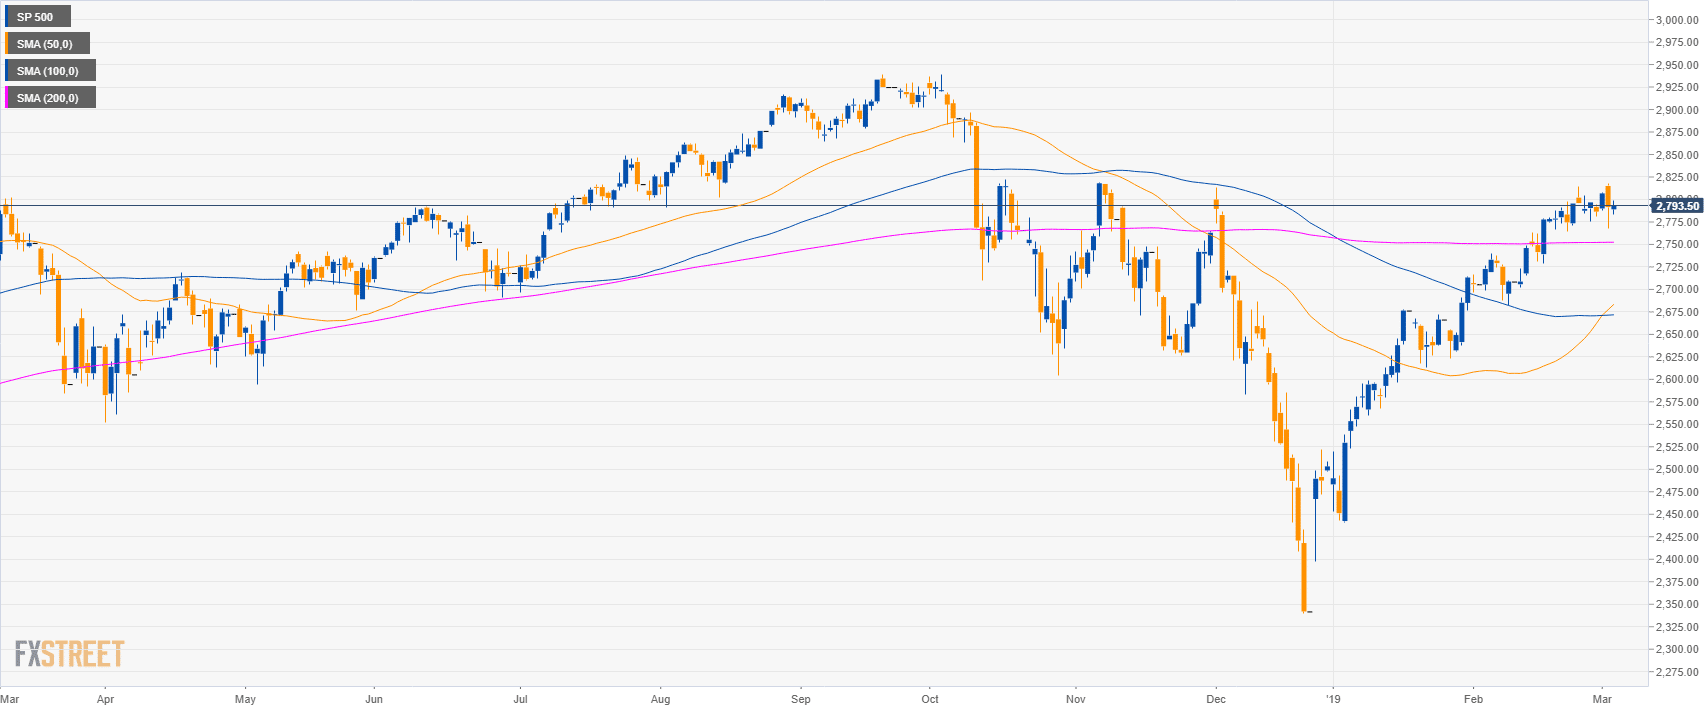
S&P500 daily chart
- The S&P500 is trading in a bull leg above the 200-day simple moving averages (SMA).
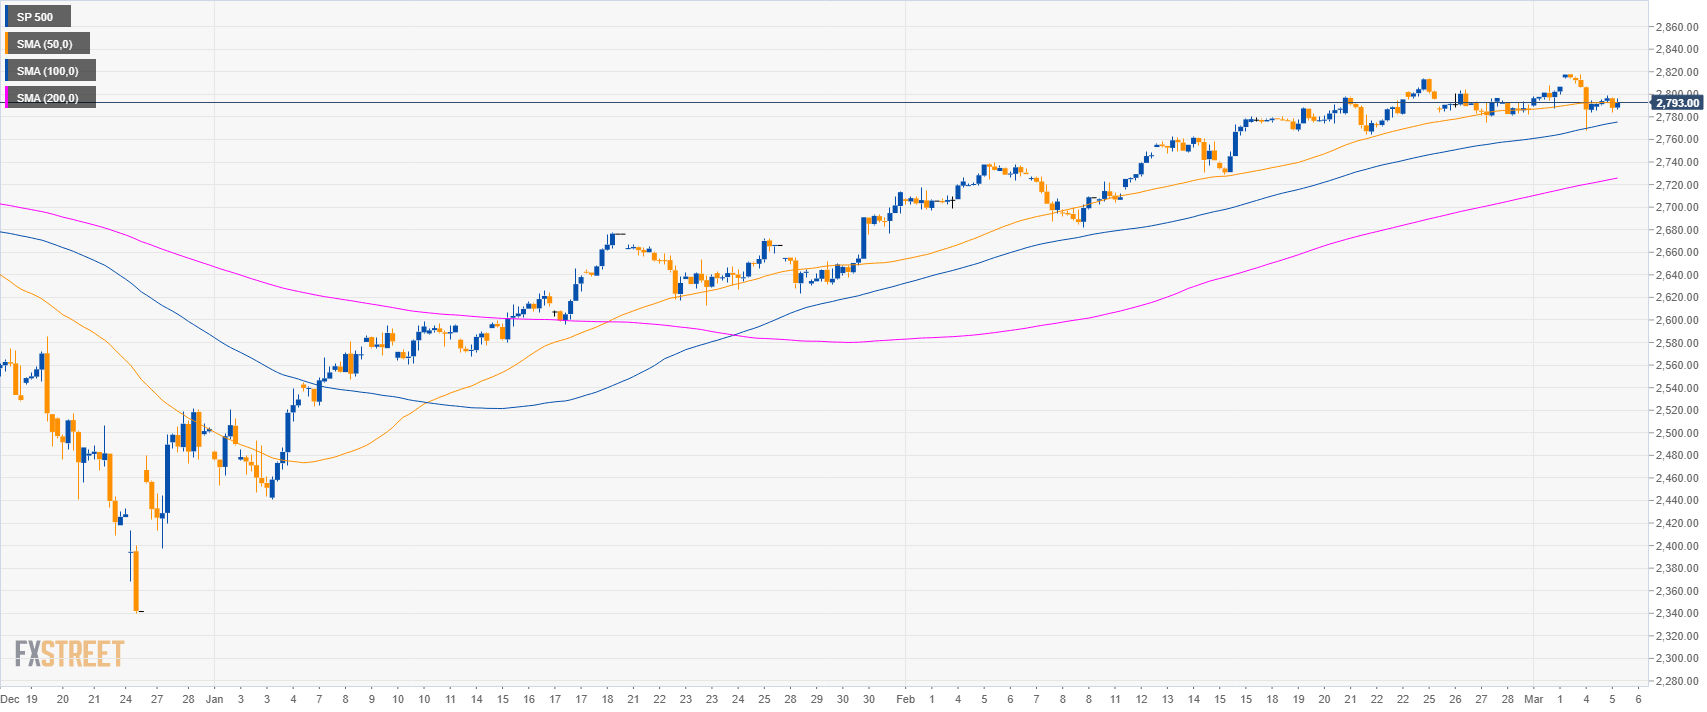
S&P500 4-hour chart
- The market is trading above its 100 and 200 SMA however below its 50 SMA, suggesting a potential pullback down.
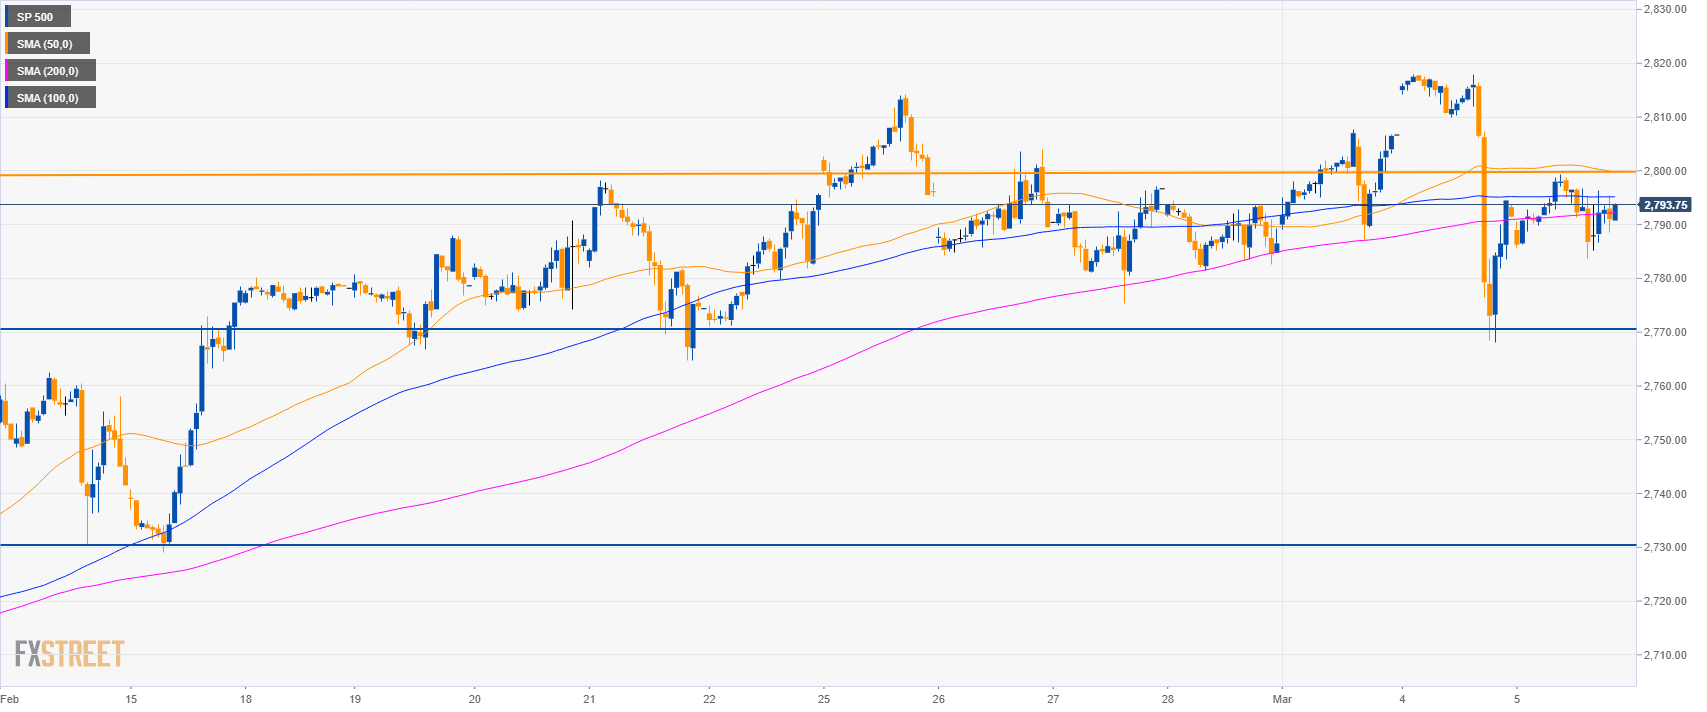
S&P500 60-minute chart
- The S&P500 is trading below its main SMAs suggesting bearish momentum.
- Resistance is at the 2,800.00 level.
- Bears will likely target 2,770.00 to the downside and 2,730.00 level in the medium-term.
Additional key levels
SP 500
Overview:
Today Last Price: 2792
Today Daily change: 50 pips
Today Daily change %: 0.02%
Today Daily Open: 2791.5
Trends:
Daily SMA20: 2762.85
Daily SMA50: 2677.35
Daily SMA100: 2671.38
Daily SMA200: 2752.41
Levels:
Previous Daily High: 2818
Previous Daily Low: 2768
Previous Weekly High: 2814.25
Previous Weekly Low: 2775.25
Previous Monthly High: 2814.25
Previous Monthly Low: 2681.75
Daily Fibonacci 38.2%: 2787.1
Daily Fibonacci 61.8%: 2798.9
Daily Pivot Point S1: 2767
Daily Pivot Point S2: 2742.5
Daily Pivot Point S3: 2717
Daily Pivot Point R1: 2817
Daily Pivot Point R2: 2842.5
Daily Pivot Point R3: 2867
