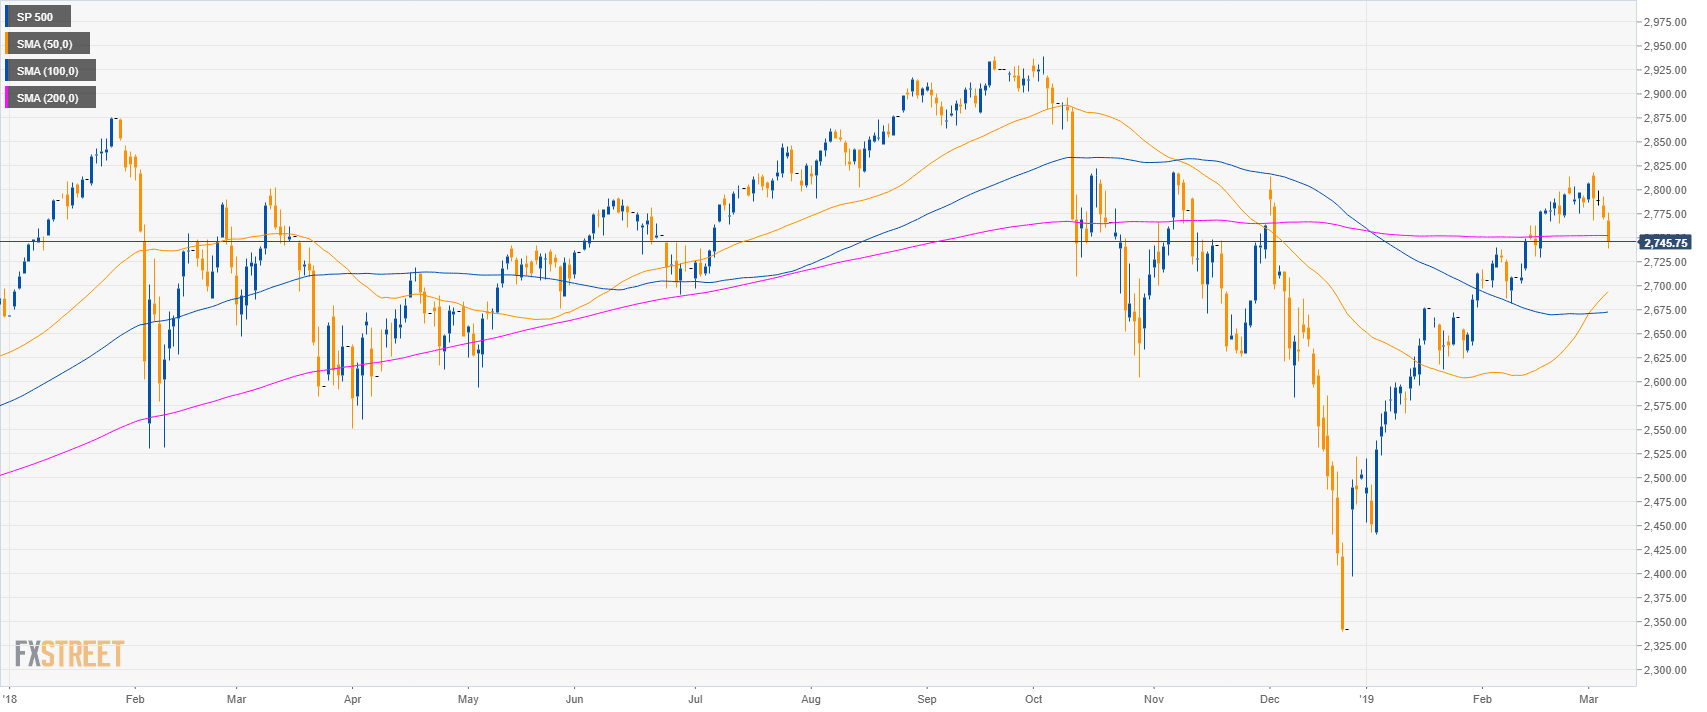
S&P500 daily chart
- The S&P500 is having a pullback down below its 200-day simple moving average (SMAs).
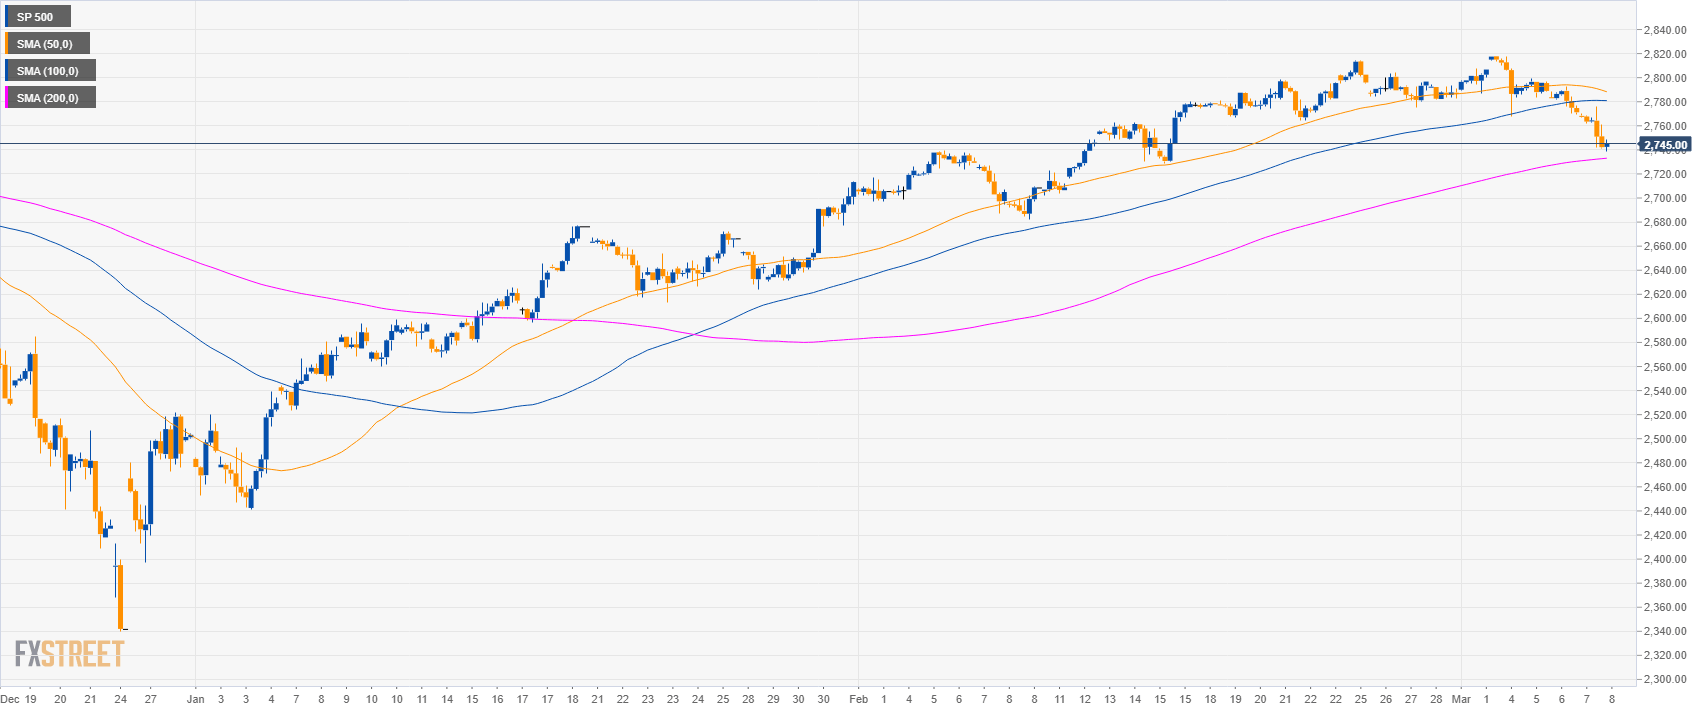
S&P500 4-hour chart
- The market is trading below its 50 and 100 SMA and is trying to find support at the 200 SMA.
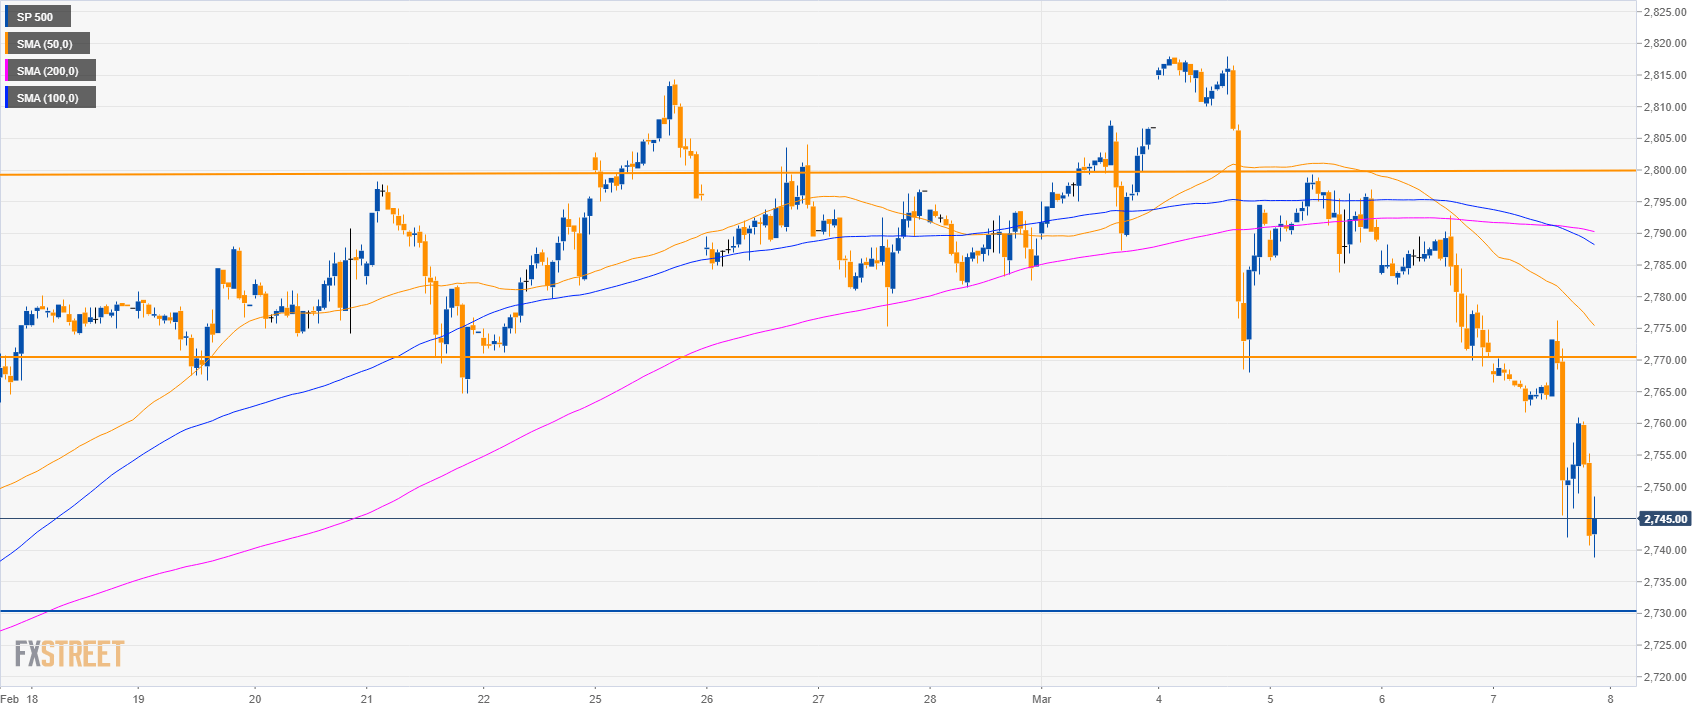
S&P500 30-minute chart
- The S&P500 is trading below its main SMAs suggesting bearish momentum.
- Bears broke below 2,770.00 support. A breach below the level can lead to a drop to 2,730.00 level.
- Resistance is at the 2,770.00 and 2,800.00 level.
Additional key levels
SP 500
Overview:
Today Last Price: 2746
Today Daily change: -25.25 ticks
Today Daily change %: -0.91%
Today Daily Open: 2771.25
Trends:
Daily SMA20: 2769.15
Daily SMA50: 2688.74
Daily SMA100: 2671.98
Daily SMA200: 2752.46
Levels:
Previous Daily High: 2792.75
Previous Daily Low: 2769
Previous Weekly High: 2814.25
Previous Weekly Low: 2775.25
Previous Monthly High: 2814.25
Previous Monthly Low: 2681.75
Daily Fibonacci 38.2%: 2778.07
Daily Fibonacci 61.8%: 2783.68
Daily Pivot Point S1: 2762.58
Daily Pivot Point S2: 2753.92
Daily Pivot Point S3: 2738.83
Daily Pivot Point R1: 2786.33
Daily Pivot Point R2: 2801.42
Daily Pivot Point R3: 2810.08
