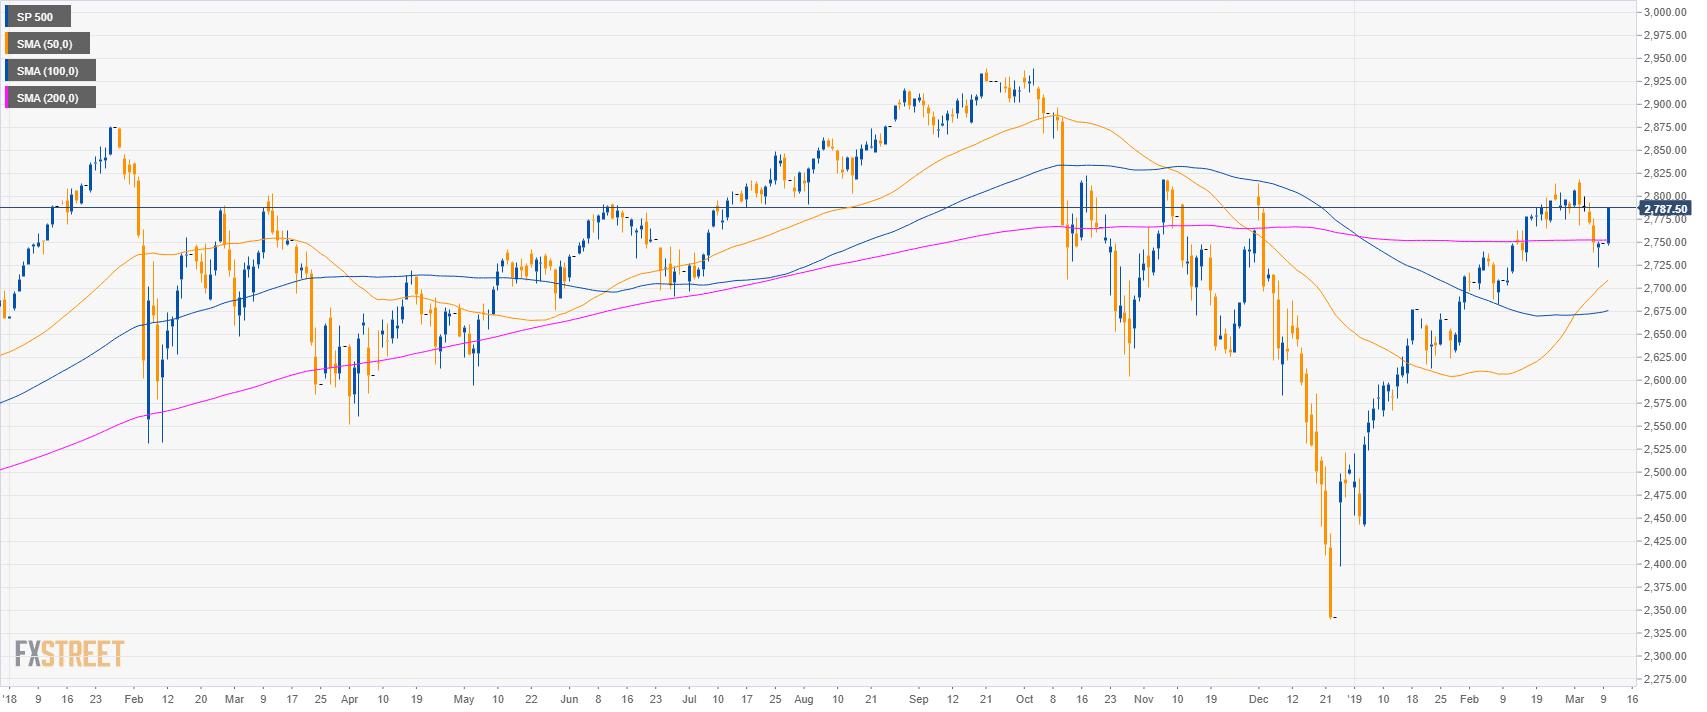
S&P500 daily chart
- The S&P500 is trading above its main simple moving average suggesting bullish momentum.
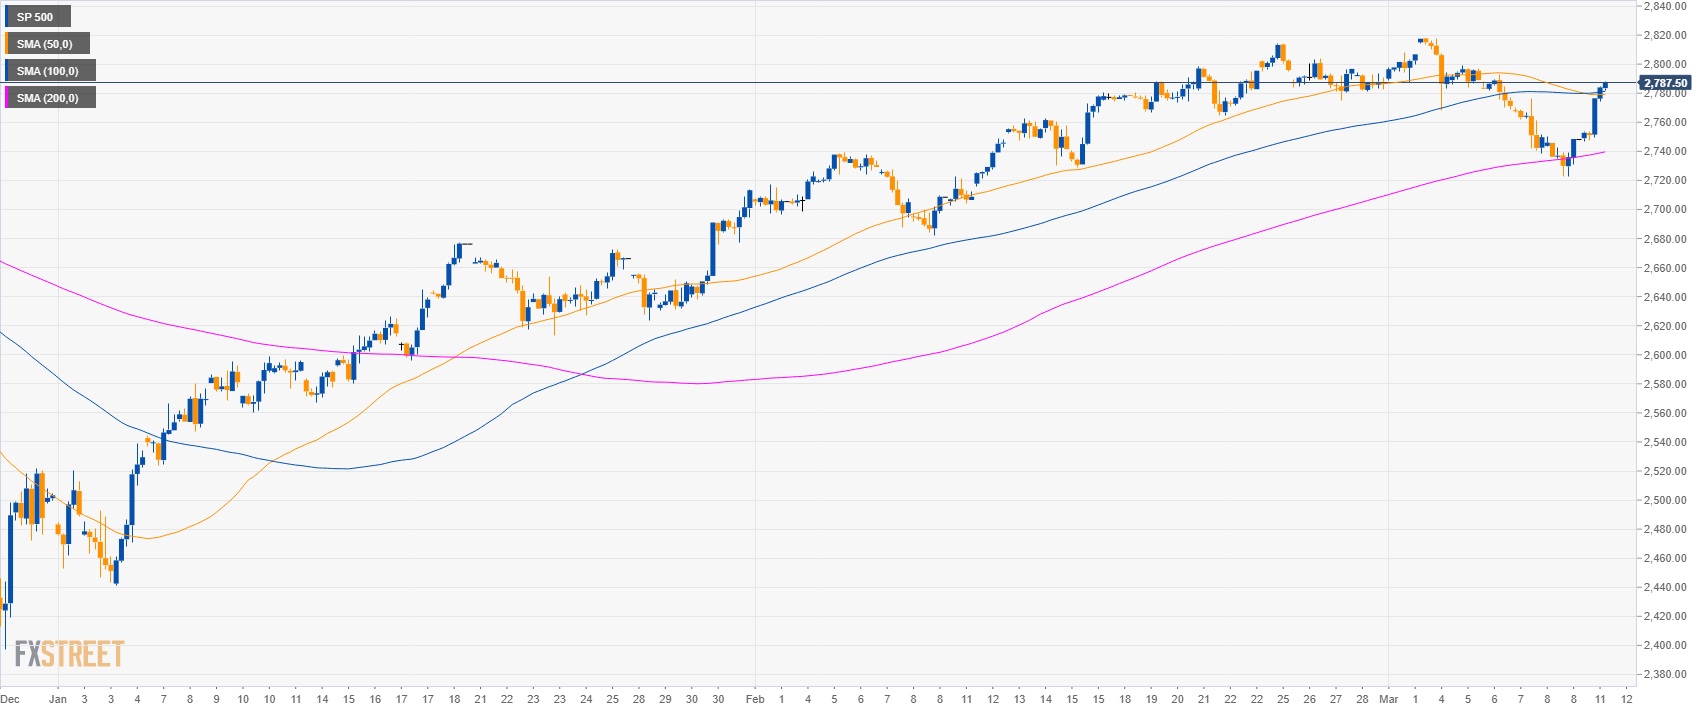
S&P500 4-hour chart
- The S&P500 is trading above its main SMAs suggesting bullish momentum in the medium-term.
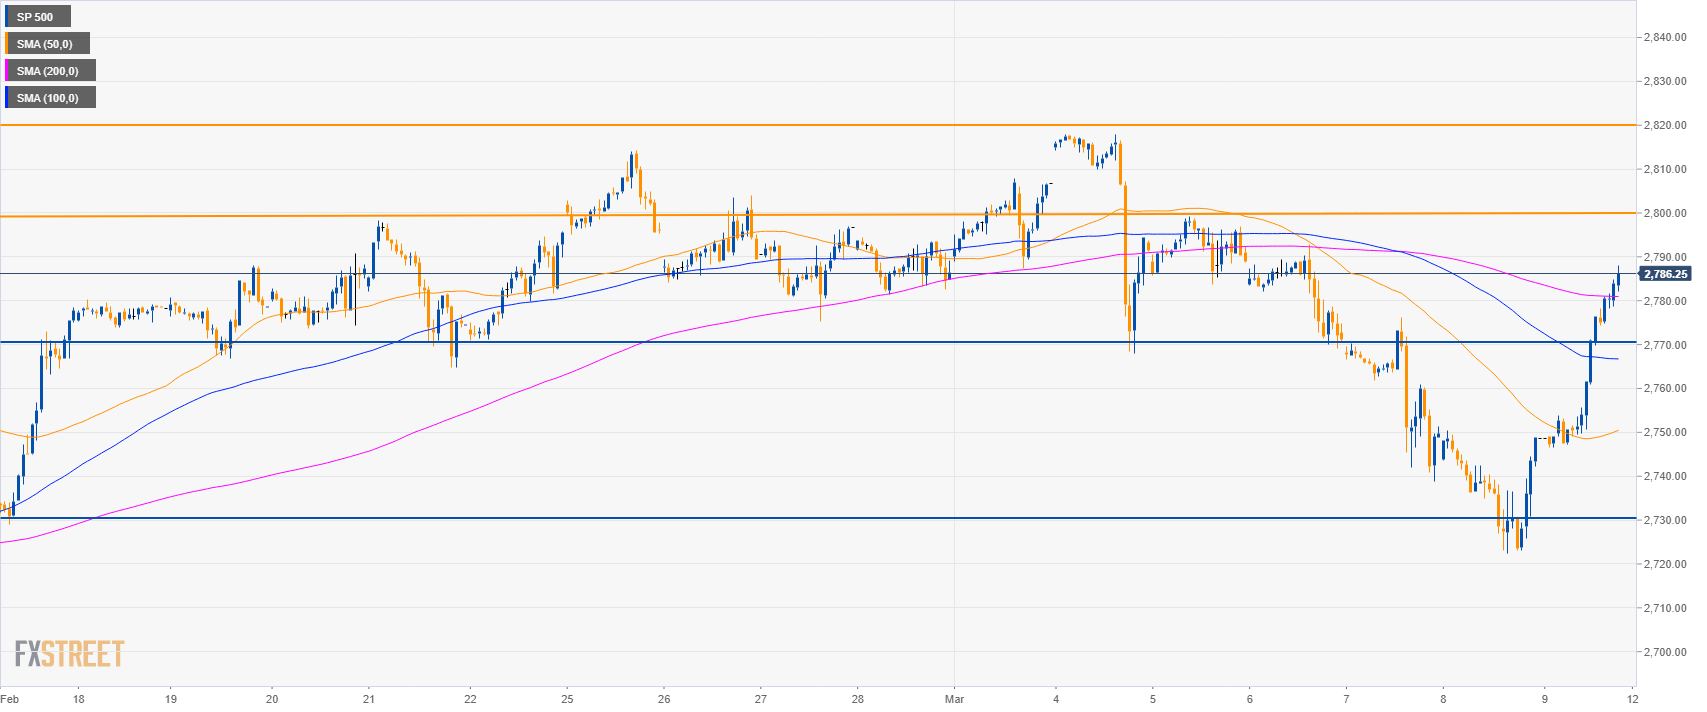
S&P500 60-minute chart
- The S&P500 is trading above its main SMAs suggesting bullish momentum in the short-term.
- A break above 2,800.00 resistance can lead to 2,820.00 level.
- To the downside, supports are seen near 2,770.00 and 2,730.00 level.
Additional key levels
SP 500
Overview:
Today Last Price: 2786.25
Today Daily change: 37.75 points
Today Daily change %: 1.37%
Today Daily Open: 2748.5
Trends:
Daily SMA20: 2775.18
Daily SMA50: 2704.26
Daily SMA100: 2674.26
Daily SMA200: 2752.3
Levels:
Previous Daily High: 2748.5
Previous Daily Low: 2748.5
Previous Weekly High: 2818
Previous Weekly Low: 2722.5
Previous Monthly High: 2814.25
Previous Monthly Low: 2681.75
Daily Fibonacci 38.2%: 2748.5
Daily Fibonacci 61.8%: 2748.5
Daily Pivot Point S1: 2748.5
Daily Pivot Point S2: 2748.5
Daily Pivot Point S3: 2748.5
Daily Pivot Point R1: 2748.5
Daily Pivot Point R2: 2748.5
Daily Pivot Point R3: 2748.5
