The V-ROC has no accredited designer and it functions by focusing on volume as opposed to price. In all other respects, the V-ROC is identical to the standard and better known Rate of Change indicator. Essentially, the V-ROC computes and then presents the rate at which volume alters.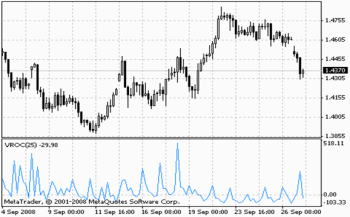
You will find that most experts recommend that volume is a useful factor to track because sharp surges in volume usually accompany changes in the direction of price. Consequently, the V-ROC can provide you with useful information representing the correlation between the directional movements of volumes and price for any asset of interest.
Guest post by Marcus Holland of Options Trading
In addition, the V-ROC is useful in detecting new bullish and bearish price trends by monitoring volume. In the diagram below, you will notice that the V-ROC oscillates about zero generating larger values when volume increases and lower readings when it declines.
The readings of the V-ROC are determined by dividing the entire volume movement over a specified time period by its initial reading at the start of that period. As such, you need to realize that if volume contracts during your chosen time-period, then a negative reading will be displayed while if it expands, then a positive value will be registered.
You can optimize your usage of the V-ROC by deploying it to identify market bottoms, market tops, breakouts and overbought/oversold conditions. You can perform these tasks by using the V-ROC because all these trading events are associated with rapid surges in volume. Experts will also recommend that you verify your V-ROC findings by seeking additional confirmation using other applicable technical indicators as well as by studying the recent trading history of the asset of interest.
However, you will be confounded by one problem should you choose to use the V-ROC. Basically, you need to decide on the optimum time-period to utilize that will allow you to best track the rate of volume change. For example, if you should choose a time period that is too small then the V-ROC could start producing readings that are too sensitive. Alternatively, if you select a time period that is excessively long, then the V-ROC could respond too slowly to major price events such as retracements and reversals.
Many experts advise, after undertaking extensive research and from their own trading experiences, that the optimum time-period to deploy is the 25-day. A major advantage of using this value is that trading charts based on this time period are relatively easy to analyze.
By studying the readings produced by the V-ROC, you can acquire deep insights into many significant trading conditions and major events. For example, if you notice that price is climbing in value but that the V-ROC readings are still oscillating about zero, then this is a major signal advising that a price reversal could occur very soon. This is because volume levels displayed are no longer supporting further price growth. In addition, you can derive a similar deduction if the V-ROC starts to retract or continues to trade in a horizontal pattern.
You can deploy the many advantageous features of the V-ROC to improve your trading results and boost your profitability in numerous ways. One of the most popular is to help differentiate real breakouts from fakeouts. This is because breakouts can very often provide you with quality trading opportunities that can be readily detected. However, you need to still adopt caution by ensuring that a fakeout does not just materialize which could stop-out your new positions.
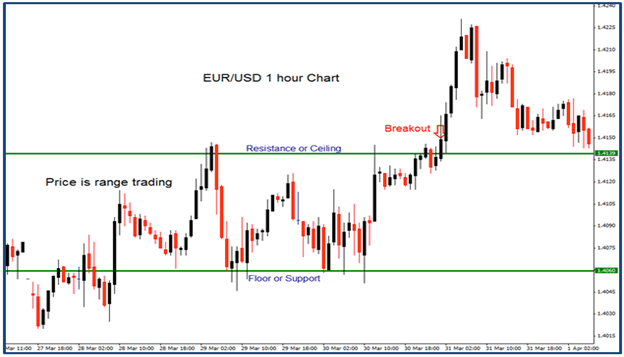
Essentially, if price has traded within a constricted range between well-defined support and resistance levels, a breakout will occur when it attains a sustained break through either of these important levels. The next chart illustrates a breakout.
In the above chart, you may well be tempted to initiate a new position as soon as price breaks above the resistance level. However, you need to be careful because a fakeout could be produced as shown on the next chart.
To protect yourself from such eventualities, you could deploy the V-ROC to provide additional confirmation before you open a new trade. In the case of a real breakout, the V-ROC will display a continuous stream of high readings. However, if a fakeout materializes then you will notice a sharp drop in volume activity.
