Dear Traders,
Many of you have already heard of the Fibonacci tool, but did you realize that Fibs can also be used as targets?
This article reviews how traders can aim for Fibonacci targets, which offers key levels for exits. And knowing where to exit a trade is in fact just as important as knowing where to enter.
With this article in hand, you will discover how to find valuable exit spots based only on the Fibonacci levels. No tool can beat its precision. Let’s start.
Fibonacci Targets
Fibonacci targets are projected spots on the chart where traders can exit for a profit; whereas Fibonacci retracement levels are entry spots that are potential bounce spots for trend continuation.
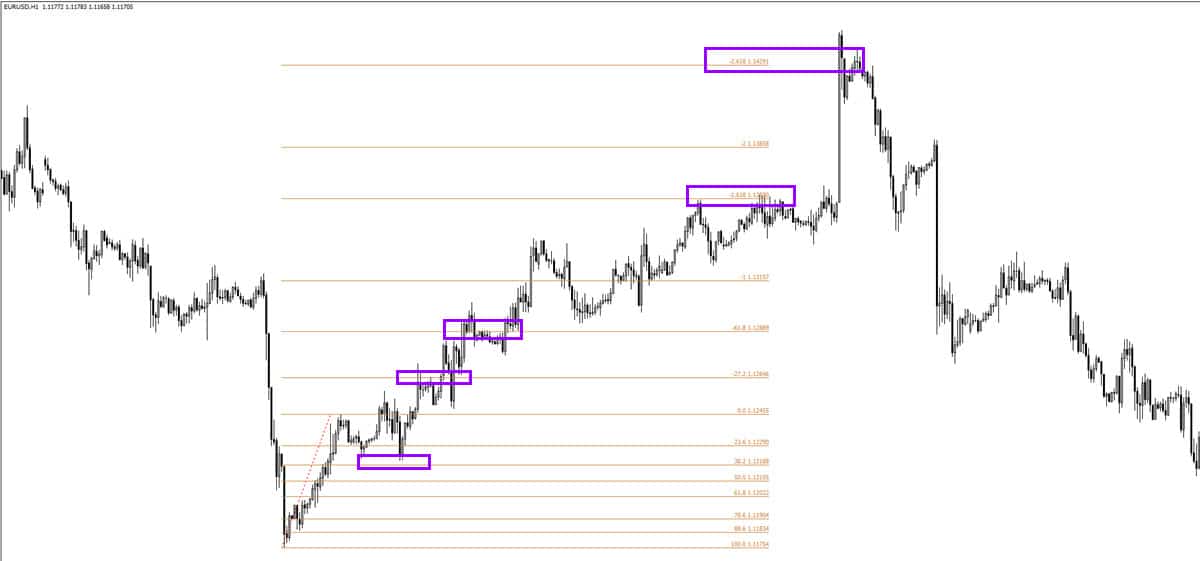
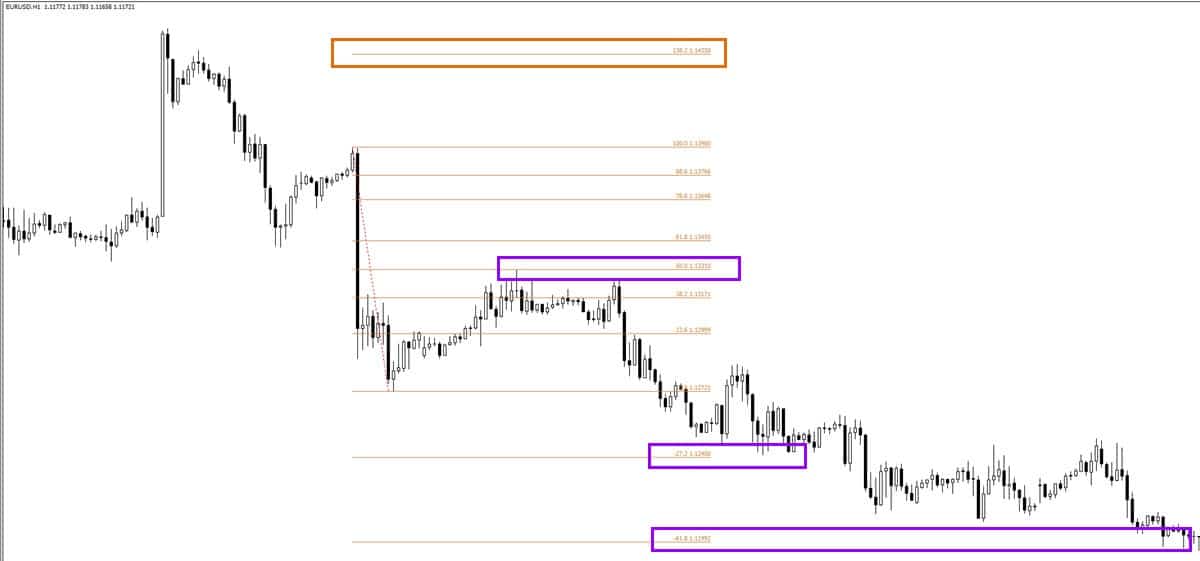
Fibonacci targets are levels which are based on the Fibonacci sequence numbers and have values above 1.000 or below 0.000 depending on how you draw the tool.
Tip: I myself add the Fibonacci targets to my Fibonacci retracement tool so I have both sets of levels on one tool. This saves me time because I only need to use 1 tool for both entries and exits.
This means that my Fibonacci retracement tool also shows Fibonacci targets – all by drawing just one tool. Handy right?
Other traders separate targets and retracements, which means that they use the Fibonacci extension tool for calculating targets and the retracement tool for pullbacks.
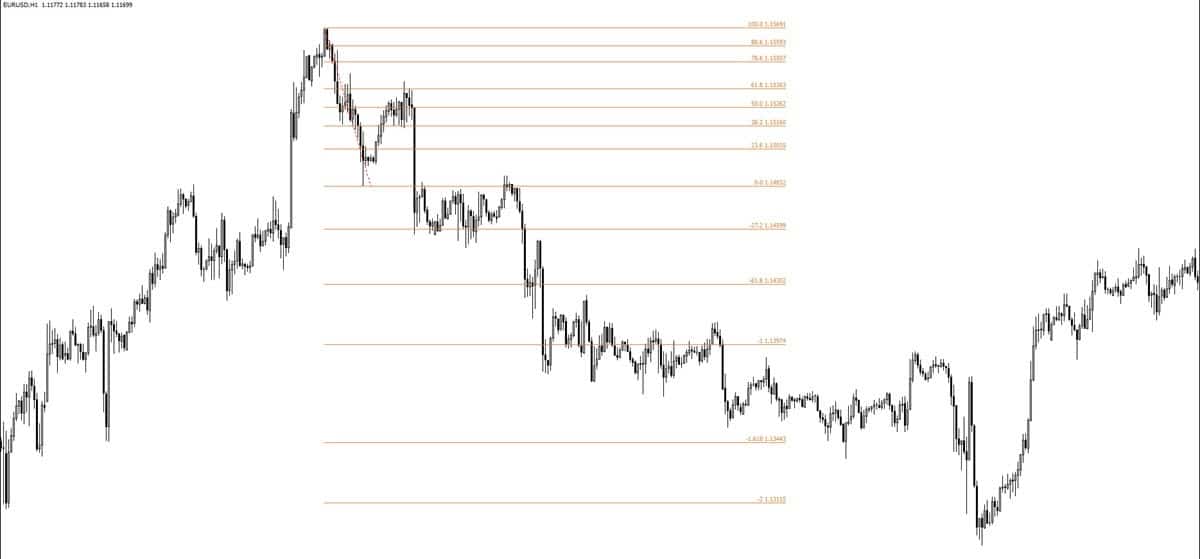
For me, the main targets are always the -0.272 and the -0.618 Fibonacci levels.
Especially the -61.8% Fibonacci target is special. Why?
These levels are unique because the market respects these levels very precisely. What I mean is that price will often continue to these targets and then switch gears and reverse only after hitting these levels.
- The -0.272 target is the main one for deep Fibonacci retracements like 78.6% and 88.6%. But the other Fibonacci retracement levels could stop at this target for a while before marching further to the next target. The -0.272 target is calculated by taking the square root of the -0.618.
- The -0.618 target is the main one for other Fibonacci retracements like 23.6%, 38.2%, 50% and 61.8% targets. The target is based on the golden ratio. In many cases the -0.618 is the best exit spot UNLESS a bigger trend continuation is expected.
- When a trend boom could occur, then price can accelerate towards higher targets as well. Here is the full list that I use:
- -1.000 Target
- -1.272 Target
- -1.618 Target
- -2.000 Target
- -2.618 Target
- -4.236 Target
- +138.2 Retracement level (break into opposite direction)
- +161.8 Retracement level (break into opposite direction)
I add the 2 levels above the 1.000 level, which is the invalidation level of the Fibonacci retracement, just in case, the price breaks my Fibonacci tool boundaries. In these cases, price has actually broken below (uptrend) or above (downtrend) the key support or resistance level of the Fibonacci tool.
Obviously we don’t expect Fib bottoms or tops to be broken otherwise the Fibonacci tool should be drawn differently. But sometimes it does occur and then having these levels on the charts helps. More is explained in our special Elliott Wave Patterns & Fibonacci Relationships Core Reference Guide.
For more information, free analysis, webinars, videos, tools, systems, and methods for trading stocks, cryptos, Forex and options, please check out my website www.EliteCurrenSea.com.
Wish you good trading,
Chris Svorcik
