- US Dollar Index (DXY) rebounds from the May’s lows.
- Strong support is seen in the 99.00/98.80 price zone.
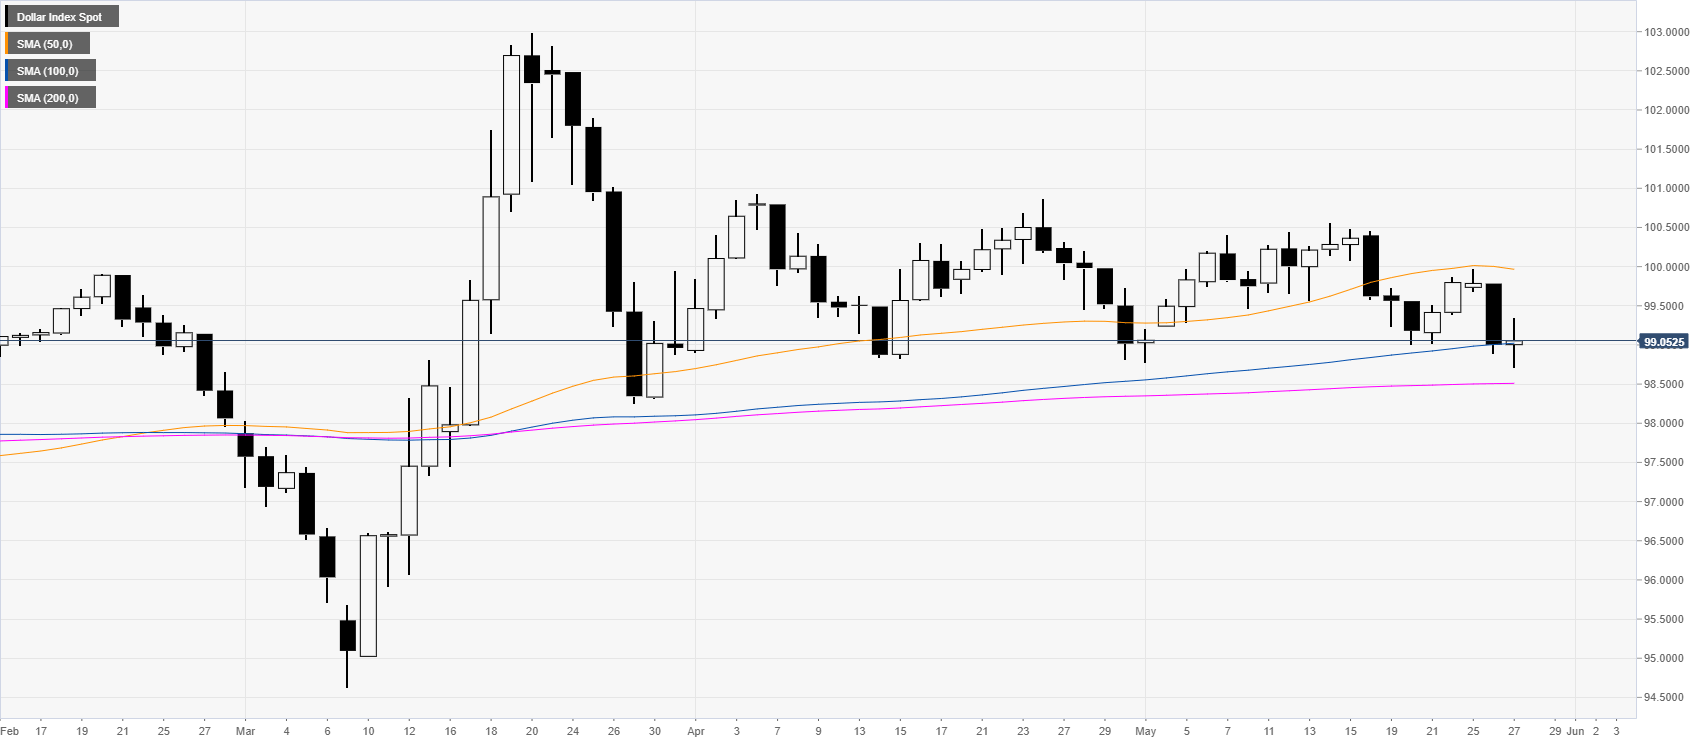
DXY daily chart
The US Dollar Index (DXY) is finding some solid support near the monthly lows close to the 99.00 level and the 100 SMA on the daily chart. However, the risk appetite mood on Wall Street is diminishing the demand for the greenback.
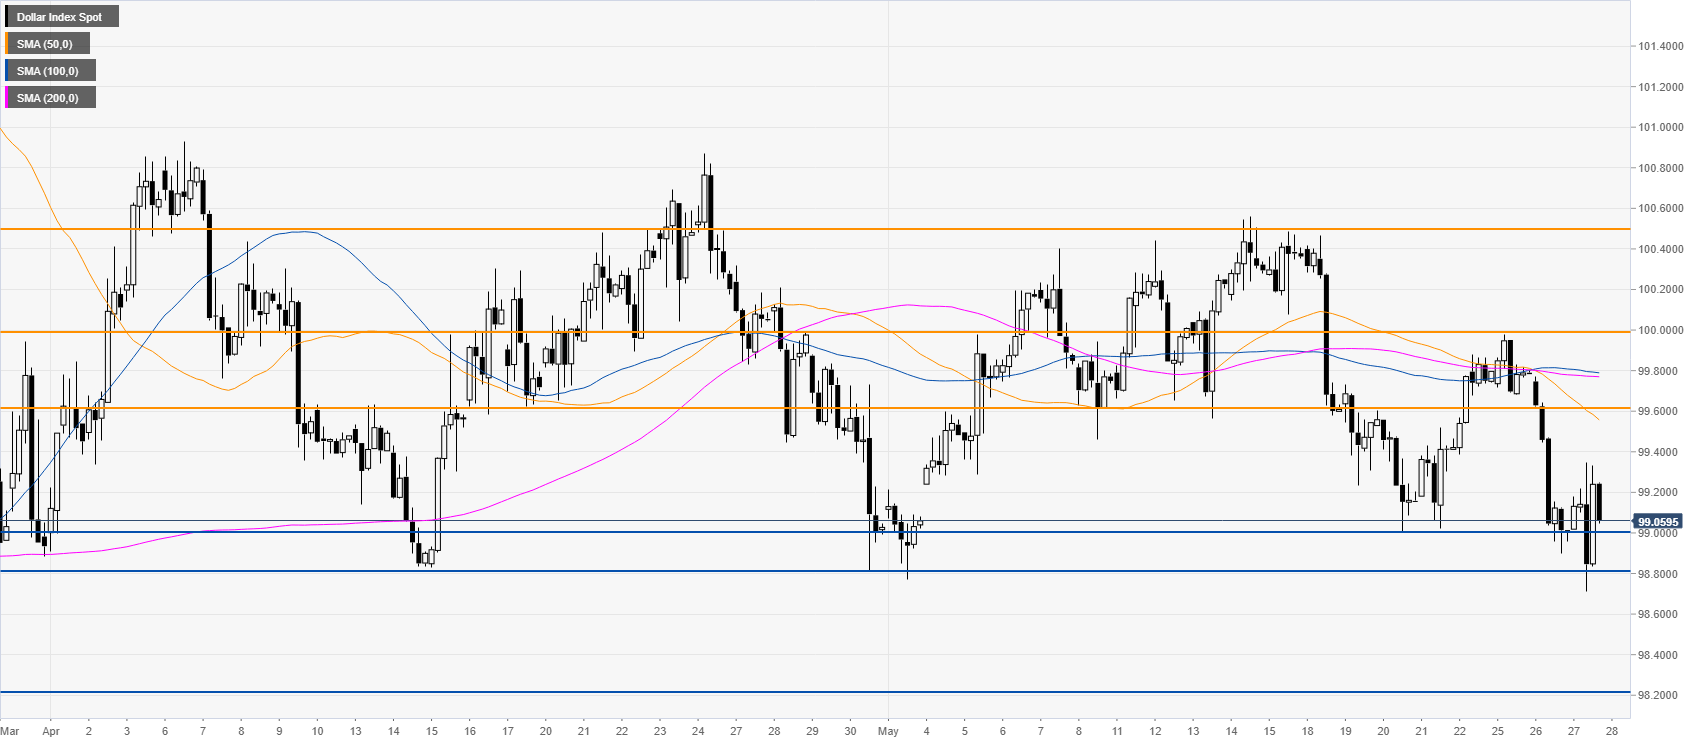
DXY four-hour chart
DXY is rebounding from the May’s lows while trading below the main SMAs on the four-hour chart. Buyers are attempting to support the market in the 99.00/98.80 price zone as it has been solid support in the last few months. On the flip side, a convincing break below the mentioned levels can yield an extension down to the 98.20/98.00 support zone.
Additional key levels
