- US dollar index (DXY) picks up steam on the second half of the week.
- The level to beat for bulls is the 100.50 level followed by the April’s highs near 101.00 figure.
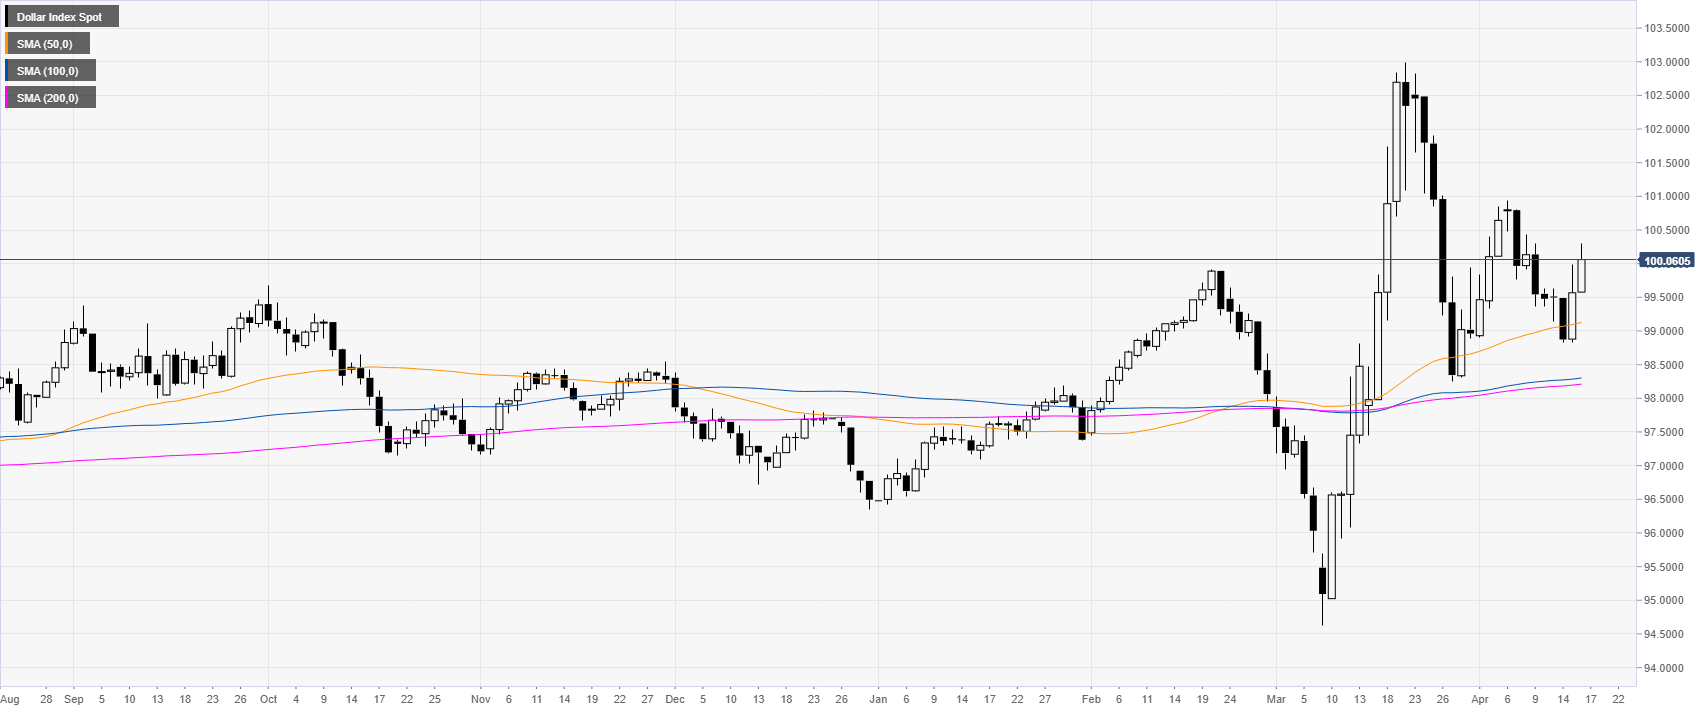
DXY daily chart
DXY is trading above the main SMAs on the daily chart on track to end the session above the 100.00 mark.
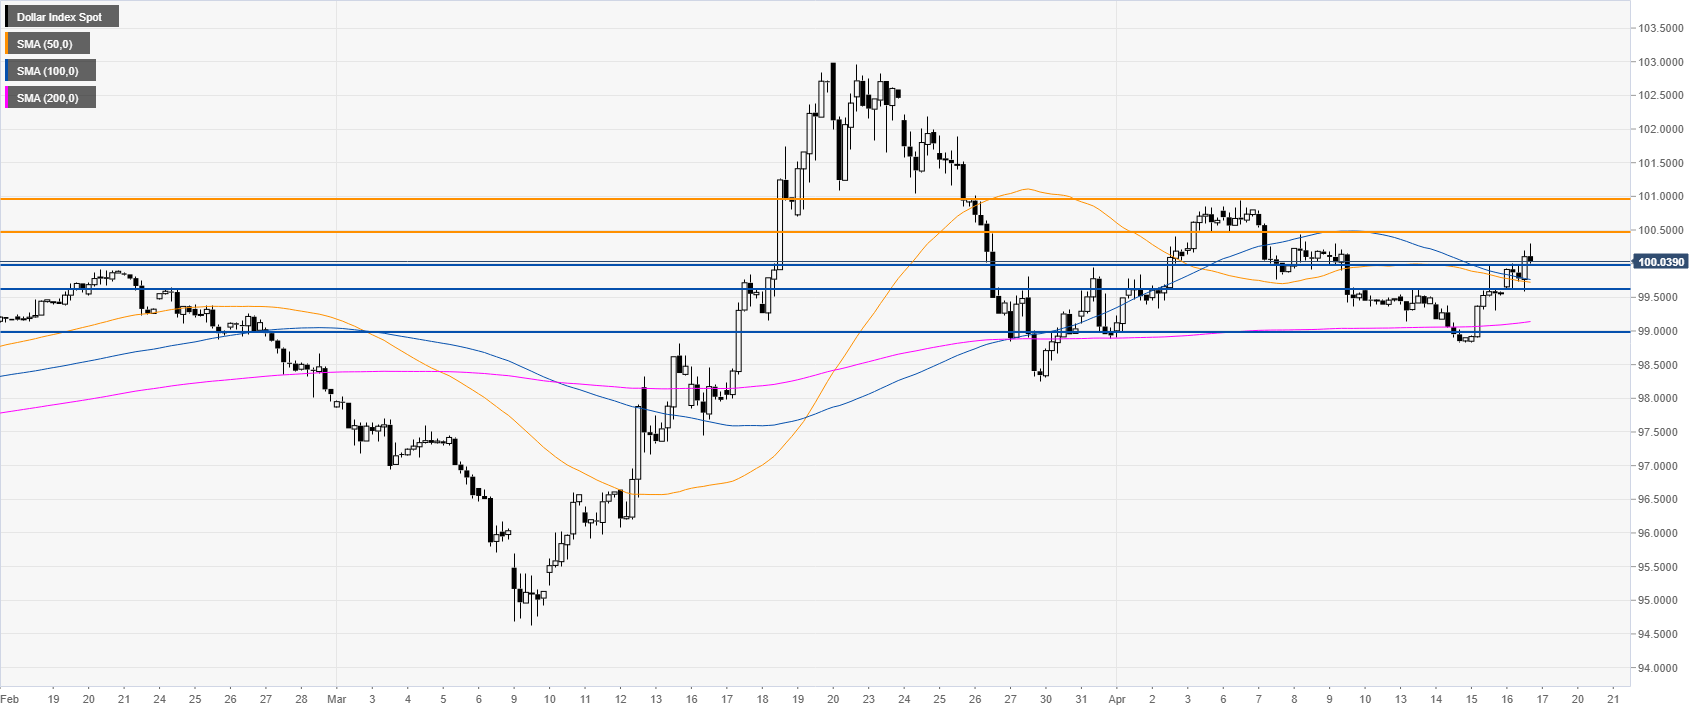
DXY four-hour chart
DXY breaks above the 100.00 psychological level while trading above the main SMAs suggesting a bullish bias in the medium term. The greenback is set to retest the April’s highs near 101.00 figure if the bulls can overcome the 110.50 level on the way up. Support is seen near 100.00 but is unlikely to hold in case of a pullback down as 99.60 could emerge next in line.
Additional key levels
