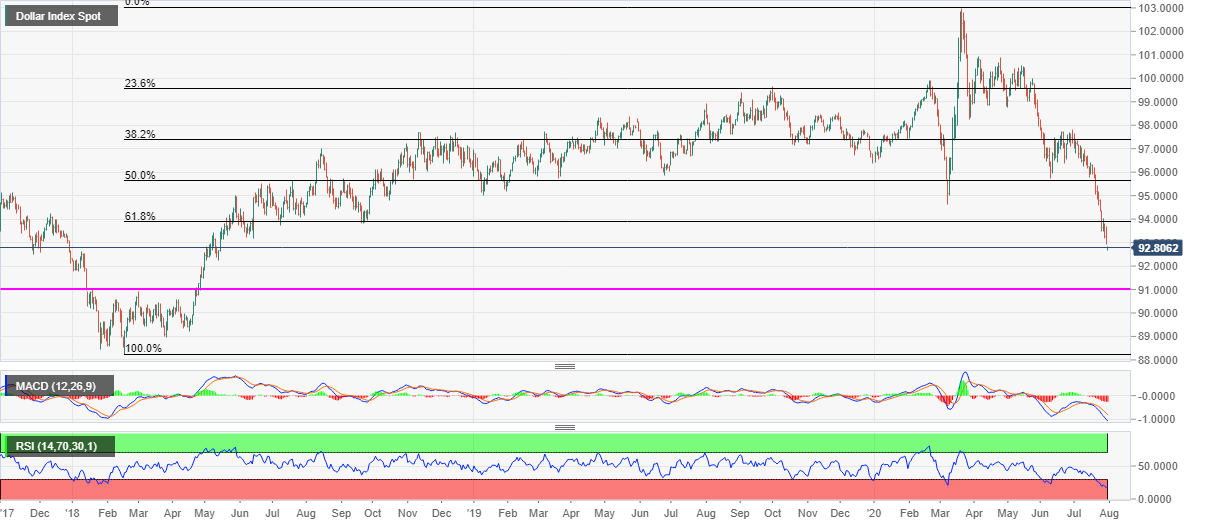
- US dollar index (DXY) prints a gap-down to refresh the lowest since mid-May 2018.
- Sustained trading below 61.8% Fibonacci retracement level of 2018-20 upside favors the bears despite oversold RSI.
- Highs marked in January and March months of 2018 on the sellers’ radar.
US dollar index (DXY) pulls back from 92.67 to 92.80 during the initial hour of Tokyo open on Friday. The greenback gauge portrayed a gap-down opening from 92.92 to drop to the lowest since May 15, 2018.
Considering the index weakness below 61.8% Fibonacci retracement of its broad run-up from February 2018 to March 20120, coupled with bearish MACD, the sellers are likely to dominate for a while.
In doing so, January and March 2018 tops surrounding 91.00 will become their favorites. However, January 01, 2018 low near 92.20 might offer an intermediate halt during the south-run.
Alternatively, 93.50 might offer immediate resistance to the quote ahead of pushing it towards a 61.8% Fibonacci retracement level of 93.90.
It should, however, be noted that any further rise past-93.90 will need validation from 94.00 to lure the bulls to target March 2020 low near 95.70.
DXY daily chart
Trend: Bearish

