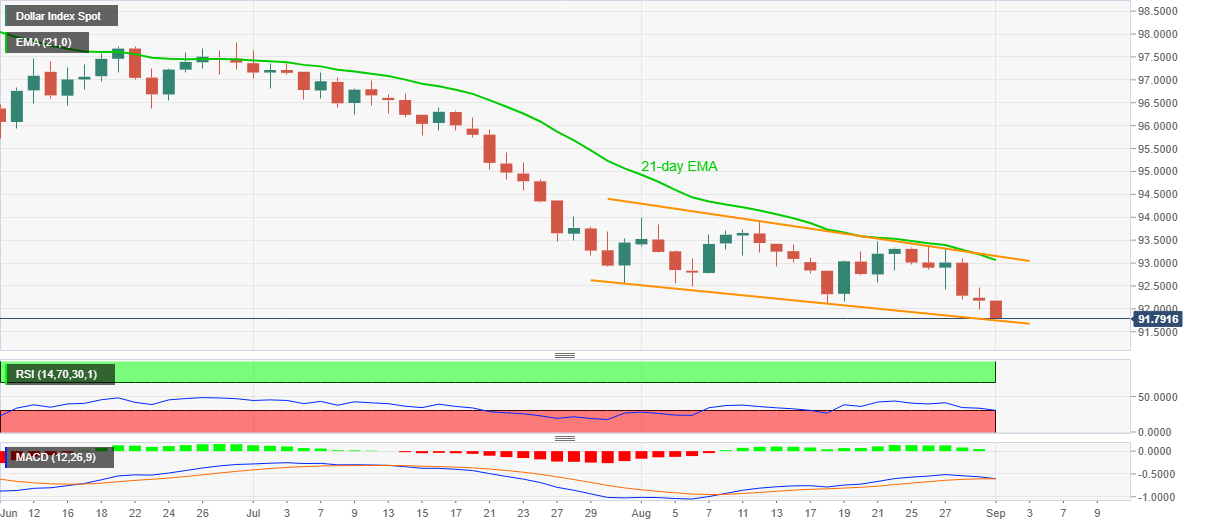
- US Dollar Index refreshes the multi-month low even as RSI turns oversold.
- Support-line of a one-month-old falling channel can trigger a pullback.
- 21-day EMA, channel’s resistance line keep the buyers away.
US dollar index (DXY) bears dominate near the lowest since May 2018 while taking offers around 91.77 during the early Tuesday. The greenback gauge keeps extending its south-run while ignoring the oversold conditions of the RSI.
As a result, the US currency index’s bounce off the support line of a falling trend channel since July 31, at 91.74 now, gains more acceptance.
However, the MACD histogram is still flirting with the bears and may drag the quote towards September 2017 bottom close to 91.00 in a case the quote drops below 91.74.
Meanwhile, the August 06 low around 92.50 can entertain the short-term buyers during the pullback moves. Though, a 21-day EMA level of 93.06 and resistance line of the mentioned channel close to 93.15 can restrict the bounce.
It’s worth mentioning that the bulls targeting the previous month’s top near 93.90 are less likely to return unless the DXY closes past-93.15.
DXY daily chart
Trend: Pullback expected

