- US dollar index eases from two-week top amid bullish MACD.
- Monthly high, half-yearly resistance line and 200-day SMA test the greenback bulls.
- Sellers will not risk entries above four-week-old support line.
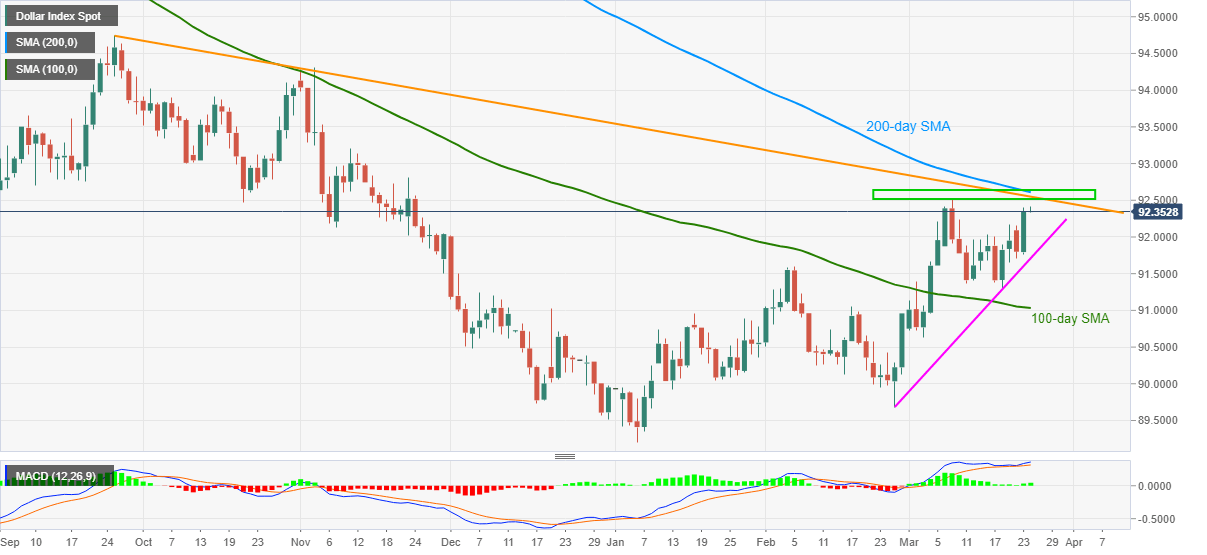
US dollar index (DXY) steps back from the monthly peak, currently around 92.35, during early Wednesday. In doing so, the greenback gauge fades the upside momentum before key resistance confluence.
However, bullish MACD and safe-haven buying can keep the DXY on the front-foot, which in turn pose risks to the 92.50-60 key hurdle.
Following that, November 11, 2020 top around 93.20 should lure the bulls while the 93.00 round-figure may offer an intermediate halt.
On the contrary, an ascending support line from February 25, at 91.70 now, restricts the short-term downside of the US dollar index.
Also acting as a downside filter is the previous month top around 91.60 and 100-day SMA near 91.00.
Overall, DXY is battling the key hurdle to the north and a decisive break will be important to watch.
DXY daily chart
Trend: Pullback expected
