- DXY accelerates the leg lower and breaks below 96.00, YTD lows.
- While the 200-day SMA at 97.81 caps the upside, further losses are likely.
DXY has already the yearly rally and broke below the key support at 96.00 the figure, area last visited in late June 2019.
Immediately to the downside now emerges the June 2019 low at 95.84. If the selling impetus gathers traction, then the March 2019 low at 95.74 should return to the radar.
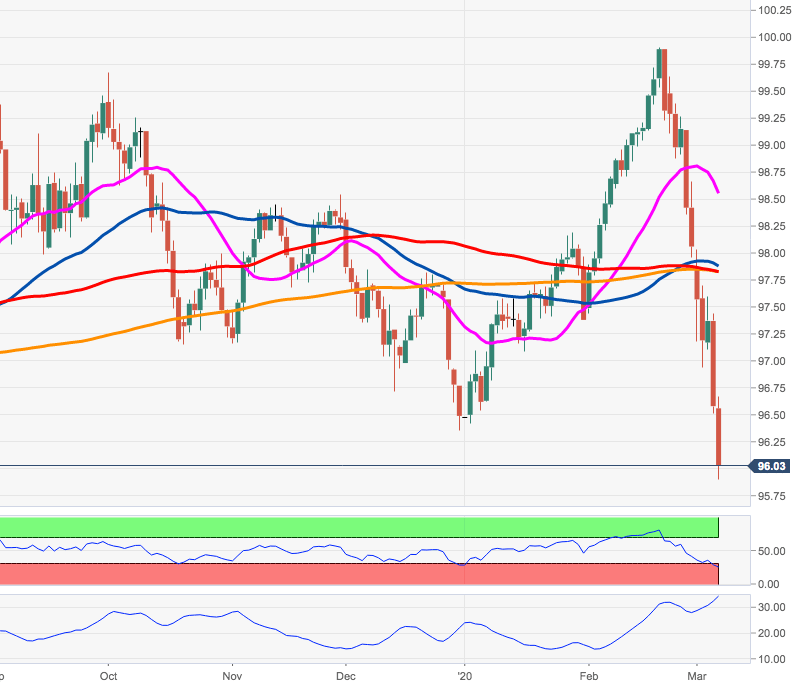
On the broader scenario, the bearish stance remains unaltered while below the critical 200-day SMA, today at 97.80.
DXY daily chart