- DXY drops below support line of short-term symmetrical triangle, 100-HMA.
- Descending RSI line can add strength bears on the confirmed break of triangle.
- Bulls will have multiple upside barriers to return before 91.00.
US dollar index (DXY) extends the previous day’s bearish move while refreshing the intraday low to 90.18, down 0.16% on a day, during Thursday’s Asian session. In doing so, the greenback sellers break the support line of a symmetrical triangle comprising levels marked since last Thursday.
Not only the triangle support but 100-HMA also highlights the 90.24 support. Though, a clear break below the previous day’s low of 90.15 becomes necessary to confirm the gauge’s further downside.
Should the quote drops below 90.15, the downward sloping RSI line will help DXY bears to eye the 90.00 round-figure ahead of challenging the monthly bottom, also the lowest since April 2018, around 89.70.
Meanwhile, the DXY bounce back beyond 90.24 figure, previous support confluence, will have to cross a falling trend line from Monday, currently around 90.48.
Even if the US dollar buyers manage to cross the 90.48 upside hurdle, Tuesday’s top near 90.75 and the weekly peak close to 91.00 will challenge further advances.
DXY hourly chart
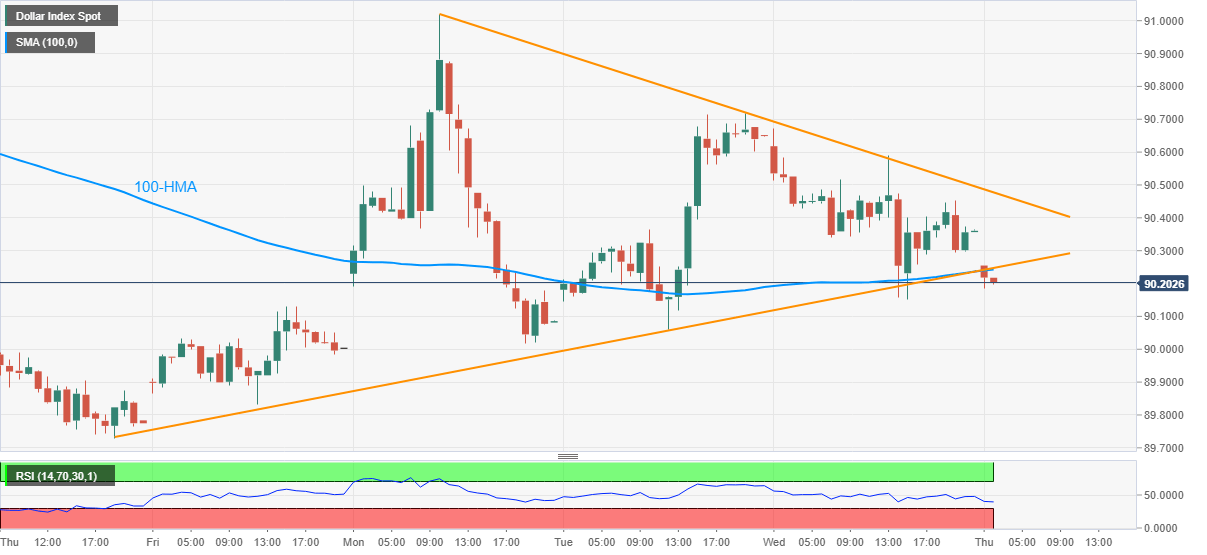
Trend: Further downside expected
