- DXY bulls take a breather around 10-week top.
- Sustained break of 200-DMA, 61.8% Fibonacci retracement back upside momentum.
- Highs marked from early March probe buyers ahead of the yearly top.
US dollar index (DXY) picks up bids around 92.30, reverses early Asian losses, during Monday’s pre-European session trading.
The greenback gauge jumped to the highest since April 09 the previous day before stepping back from 92.40. Even so, the index keeps the latest week’s upside break of 200-day SMA (DMA) and 61.8% Fibonacci retracement of March-May declines amid the firmer Momentum line.
The same joins the rush to risk-safety that puts a safe-haven bid under the US dollar to keep the DXY on the bull’s radar.
However, a horizontal area comprising multiple tops marked since early Mach, around 92.50-55, becomes a tough nut to crack for the USD bulls before targeting the yearly high of 93.43.
During the run-up, the 92.90 and the 93.00 threshold may also act as short-term resistances.
Meanwhile, pullback moves may initial aim for 61.8% Fibonacci retracement level surrounding 91.95 before challenging the 91.50-48 support confluence including 200-day SMA and 50% Fibonacci retracement.
Even if the DXY drops below 91.48, March’s low near 91.30 can act as an extra filter to the south.
DXY daily chart
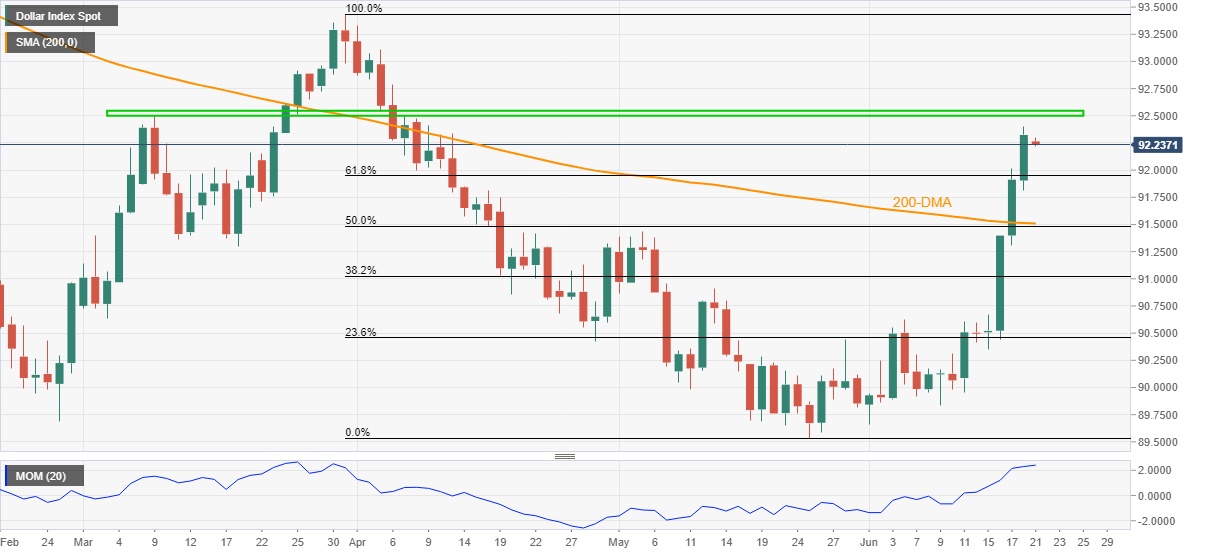
Trend: Bullish
