- DXY consolidates gains after an exceptional spike up.
- The level to beat for buyers is the 103.00 figure.
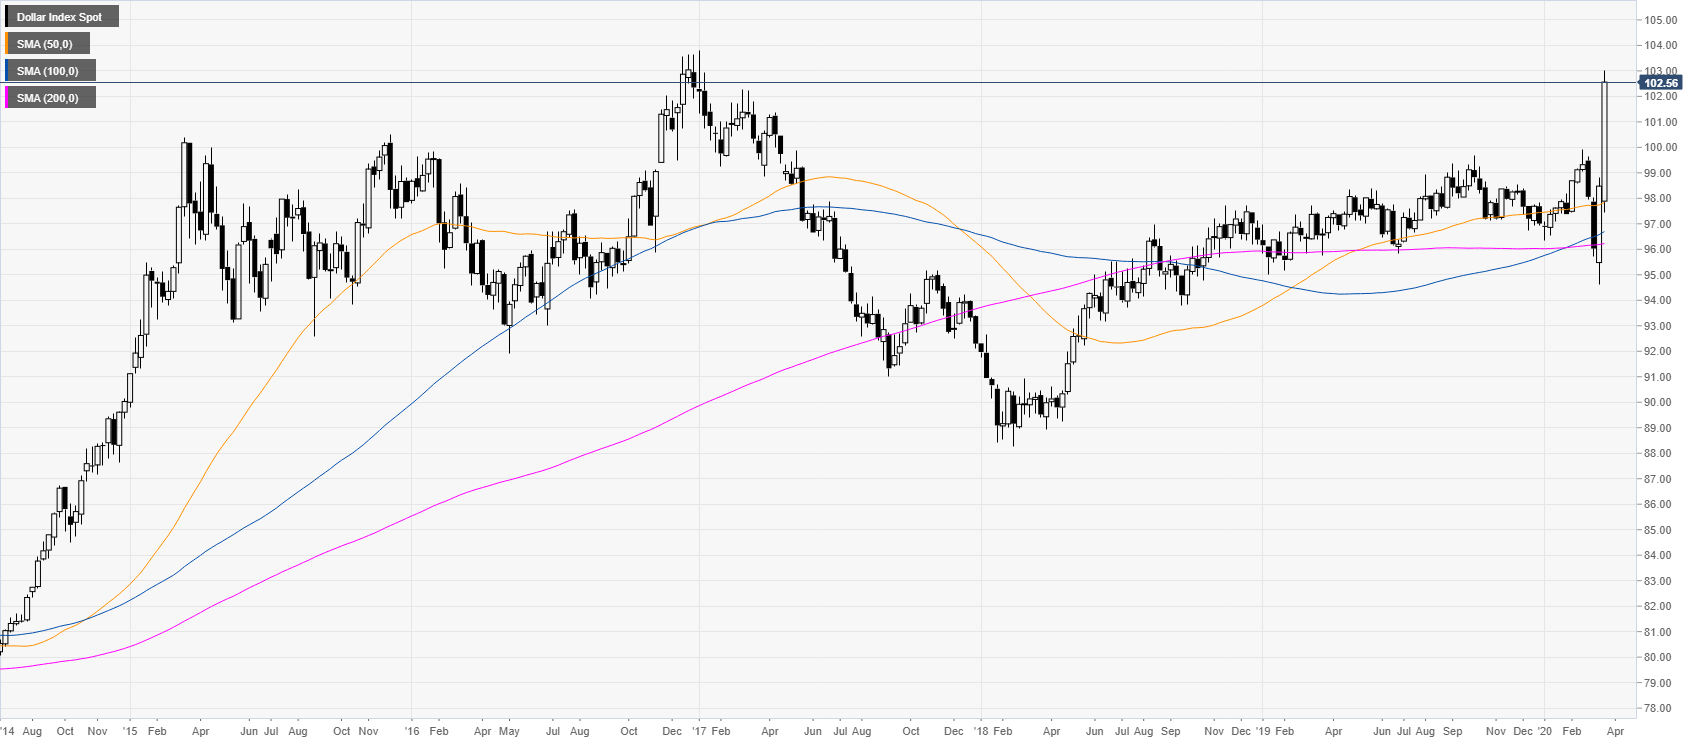
DXY weekly chart
DXY (US dollar index) is trading at its highest point since January 2017 as the greenback is benefitting from above-average buying interest as huge de-leveraging is leading to a run into the US dollar.
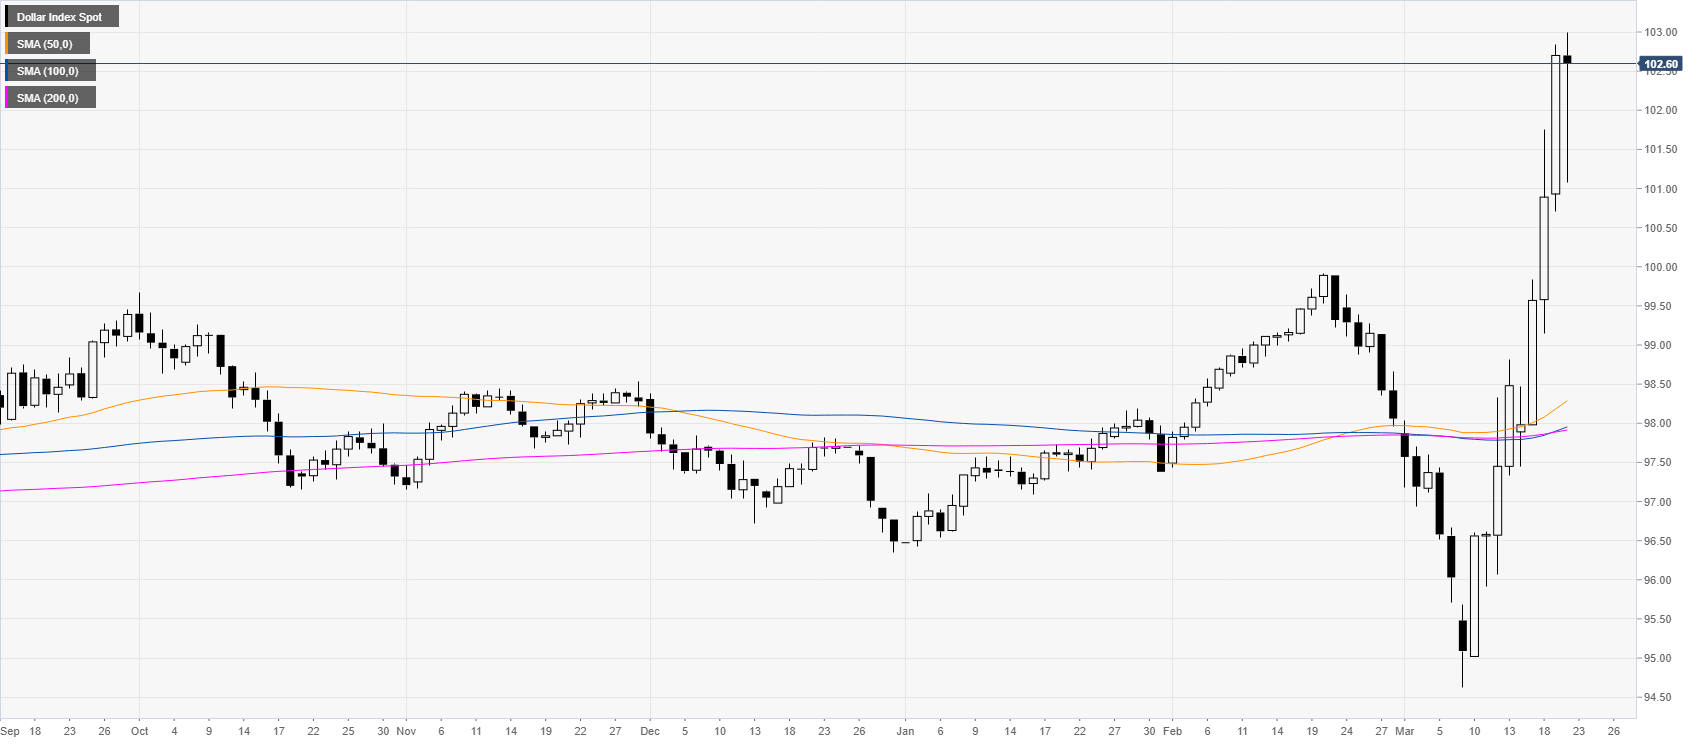
DXY daily chart
DXY is consolidating the massive spike up while trading near weekly highs.
DXY four-hour chart
The uptrend stays intact as DXY is trading above the main SMAs. Buyers will be looking for a break above the 103.00 resistance which could introduce scope to the 104.00 and 105.00 figures in the coming days or weeks. Support can be seen near the 102.00, 101.50 and 100 levels on the way down.
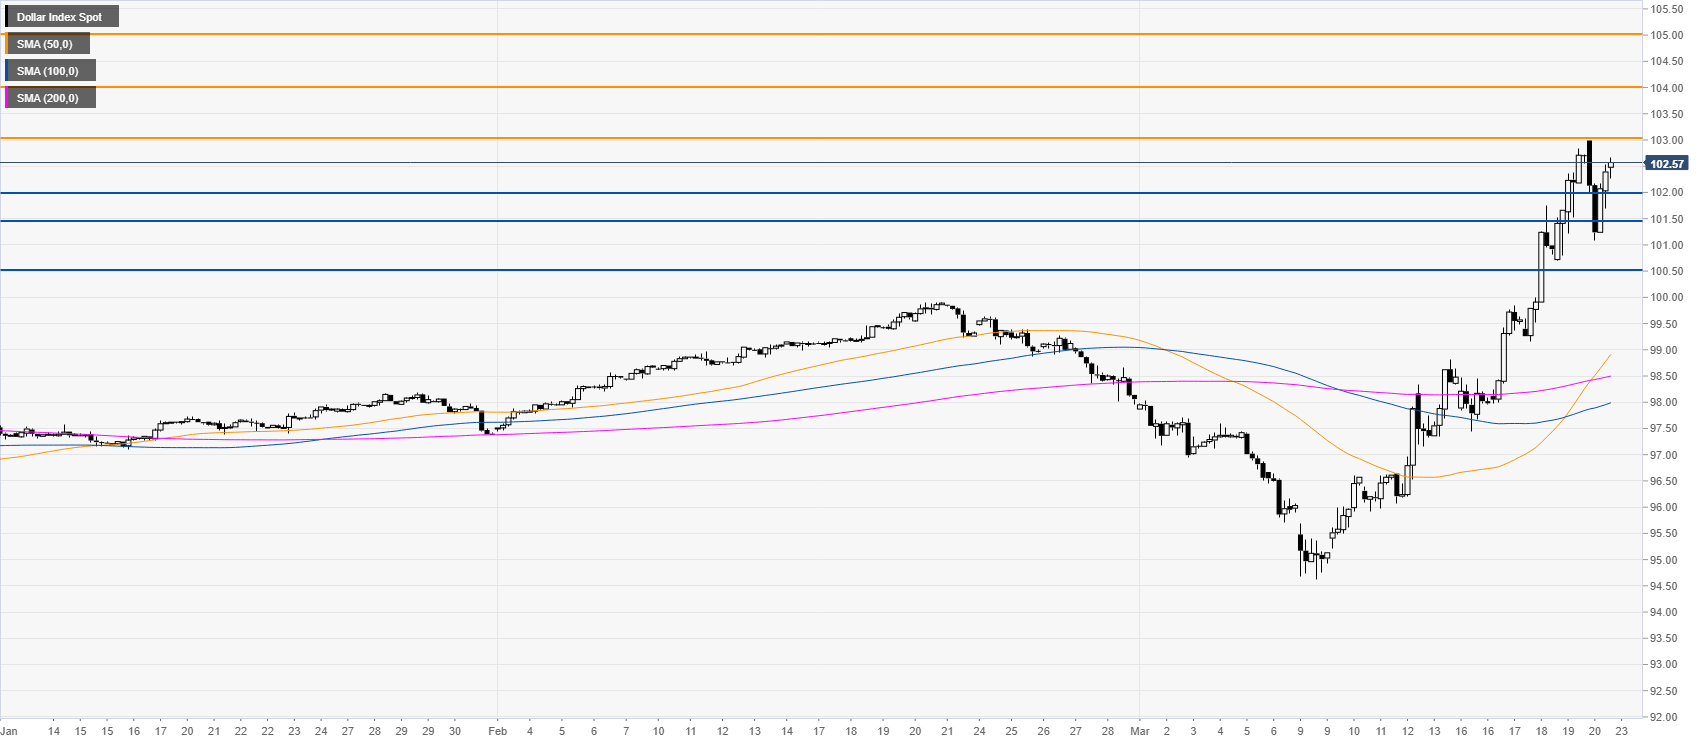
Additional key levels
