- DXY erased the last two days of gains as the market is pulling back down from 2020 highs.
- Sellers are expecting a deeper retracement below the 99.20 support level.
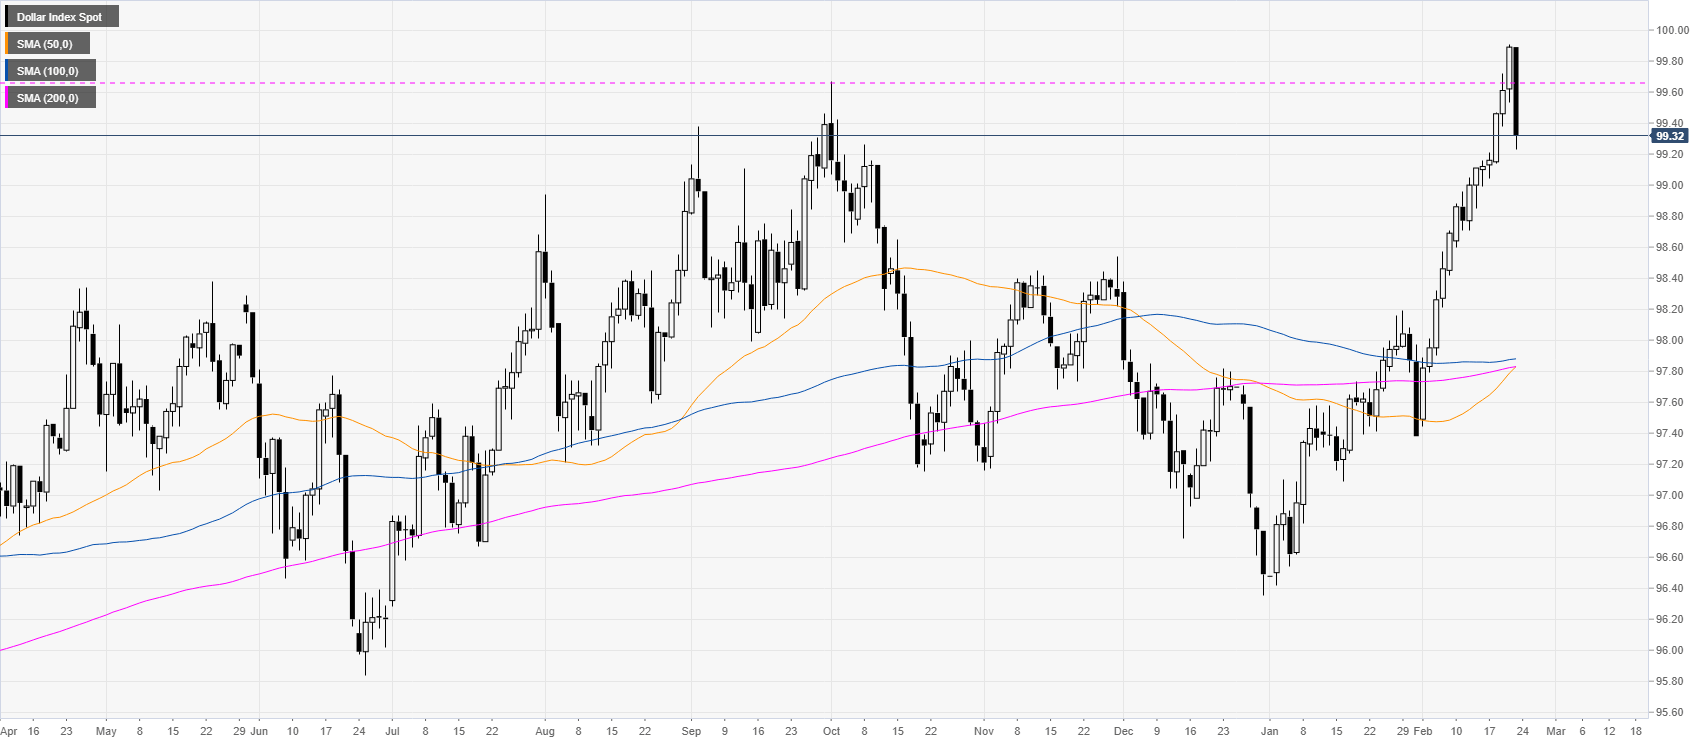
DXY daily chart
The US dollar index (DXY) is pulling back down, on track to close below the 2019 high at 99.67 level. DXY erased the gains of the last two days this Friday.
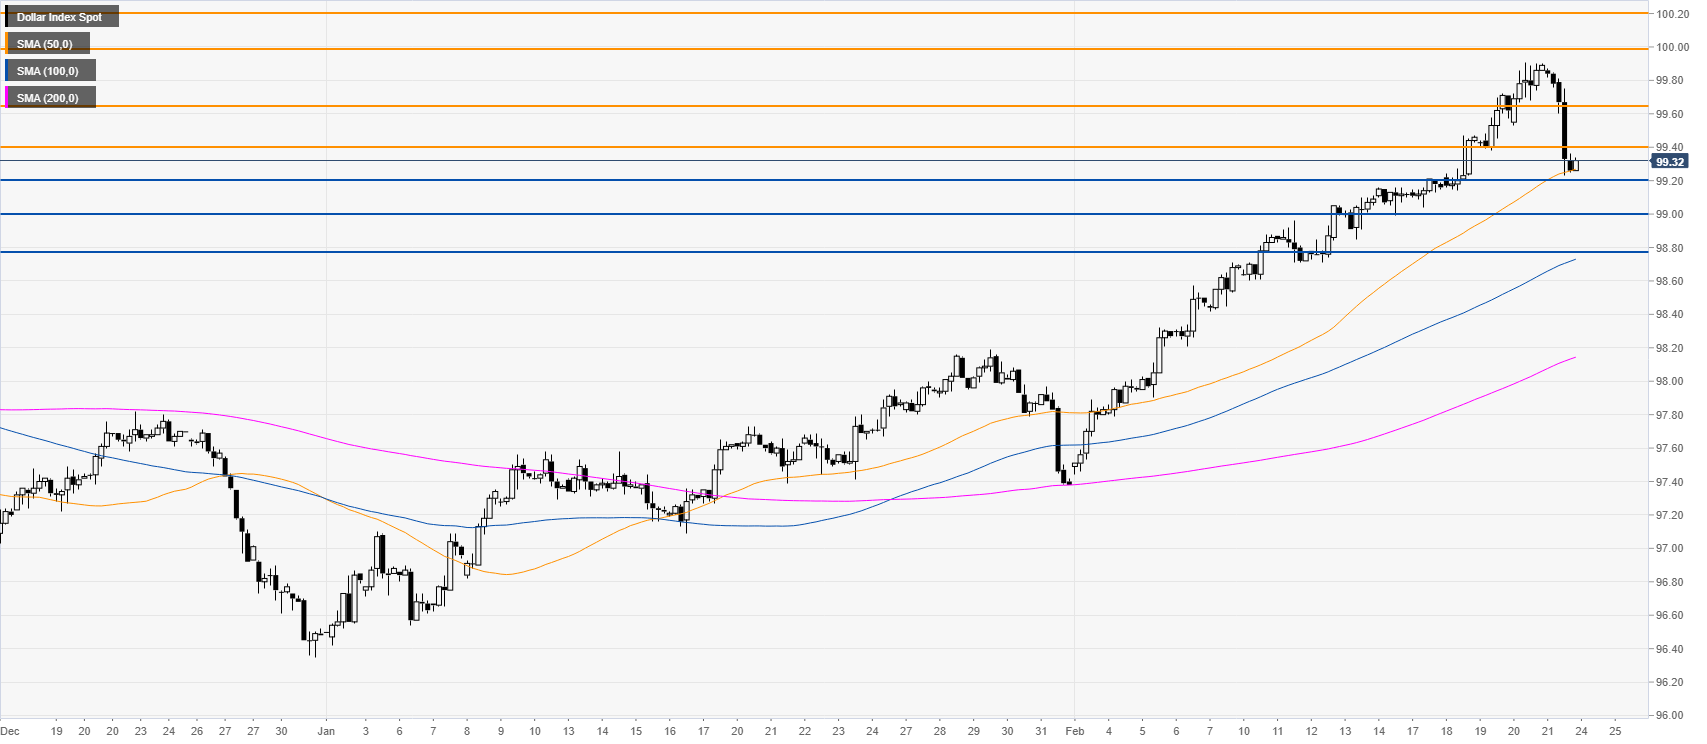
DXY four-hour chart
DXY fell sharply and tested the 50 SMA. The trend remains bullish however a deeper pullback cannot be ruled out. Bears can try to break below the 99.20 support and generate an extention down towards the 99.00 and 98.80 support level. A resumption of bullish movements can find resistance near the 99.40 and 99.65 levels.
Additional key levels
