- DXY edges higher close to two-month top flashed the previous day.
- 50% Fibonacci Retracement, multiple levels since August 2020 probe buyers.
- Sellers may not take risk of entry beyond 200-DMA.
- Further gains envisioned on bullish MACD, sustained trading above the key SMA.
US dollar index (DXY) steps back from mid-April tops during early a sluggish Asian session on Friday. That said, the DXY seesaws around 91.90 after rising to the fresh high in nine weeks the previous day.
In doing so, the greenback buyers consolidate recent gains from 50% Fibonacci retracement of September 2020 to January 2021 downside, as well as a 10-month-old horizontal resistance area, surrounding 91.95-92.00.
Even so, the bullish MACD and the quote’s sustained trading beyond 200-day SMA (DMA) backs the DXY bulls to overcome the 92.00 hurdle, which in turn could aim for an early March high of 92.50.
However, any further upside will be questioned by 61.8% Fibonacci retracement and the yearly resistance line, respectively around 92.65 and 92.90.
Meanwhile, pullback moves can be less worrisome until staying beyond the 200-DMA level of 91.51.
It’s worth noting that tops marked in February and May, around 91.60 and 91.43 respectively, act as additional filters to the downside.
DXY daily chart
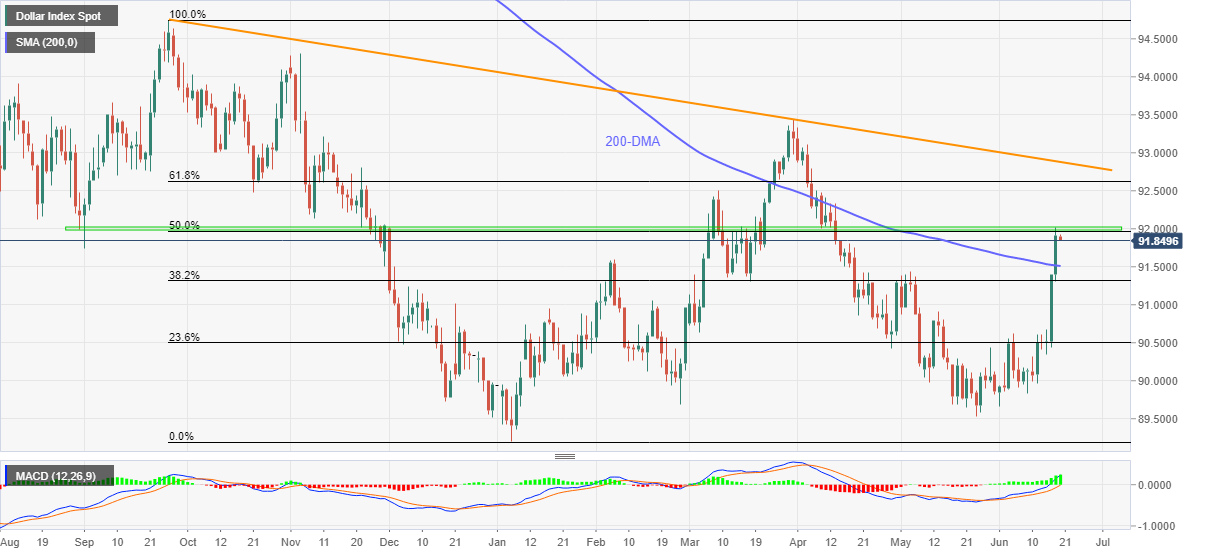
Trend: Bullish
