- US dollar index (DXY) recouped some of the losses incurred last week.
- The level to beat for buyers is the 101.00 resistance.
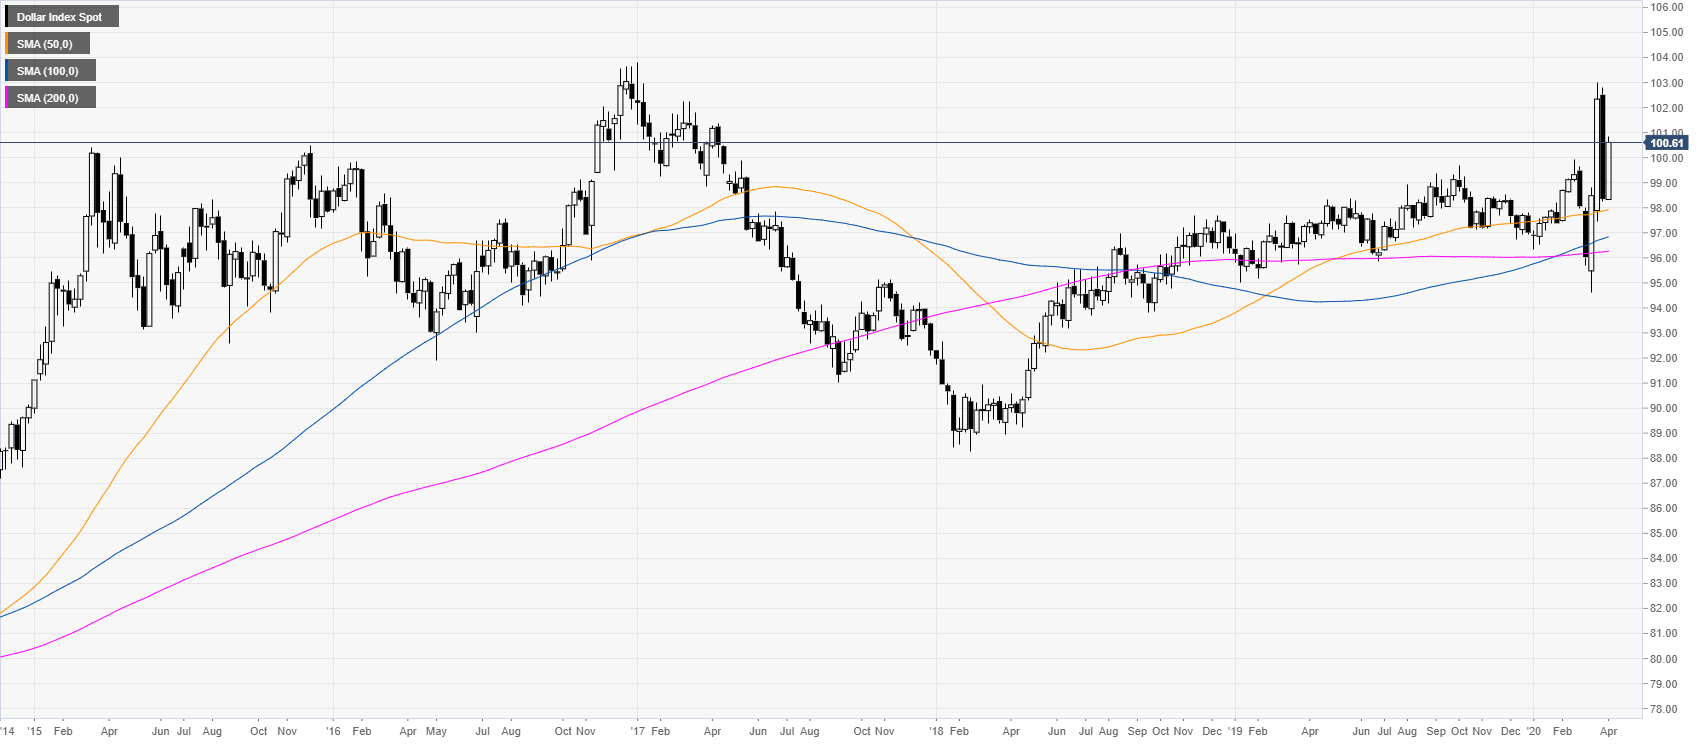
DXY weekly chart
DXY is trading in a bull trend above the main weekly SMAs on the weekly chart as this week the market recouped some of the losses incurred last week.
DXY four-hour chart
DXY gained steam until the end of the week where it is now trading above the 100.50 level and the main SMAs suggesting bullish momentum in the medium term. Buyers are likely looking for a continuation to the upside with the 101.00 handle as first hurdle followed by 101.50 en route to 103.00, the 2020 tops. On the flip side, support would be expected near the 101.50, 101.00 and 99.50 levels on any dips.
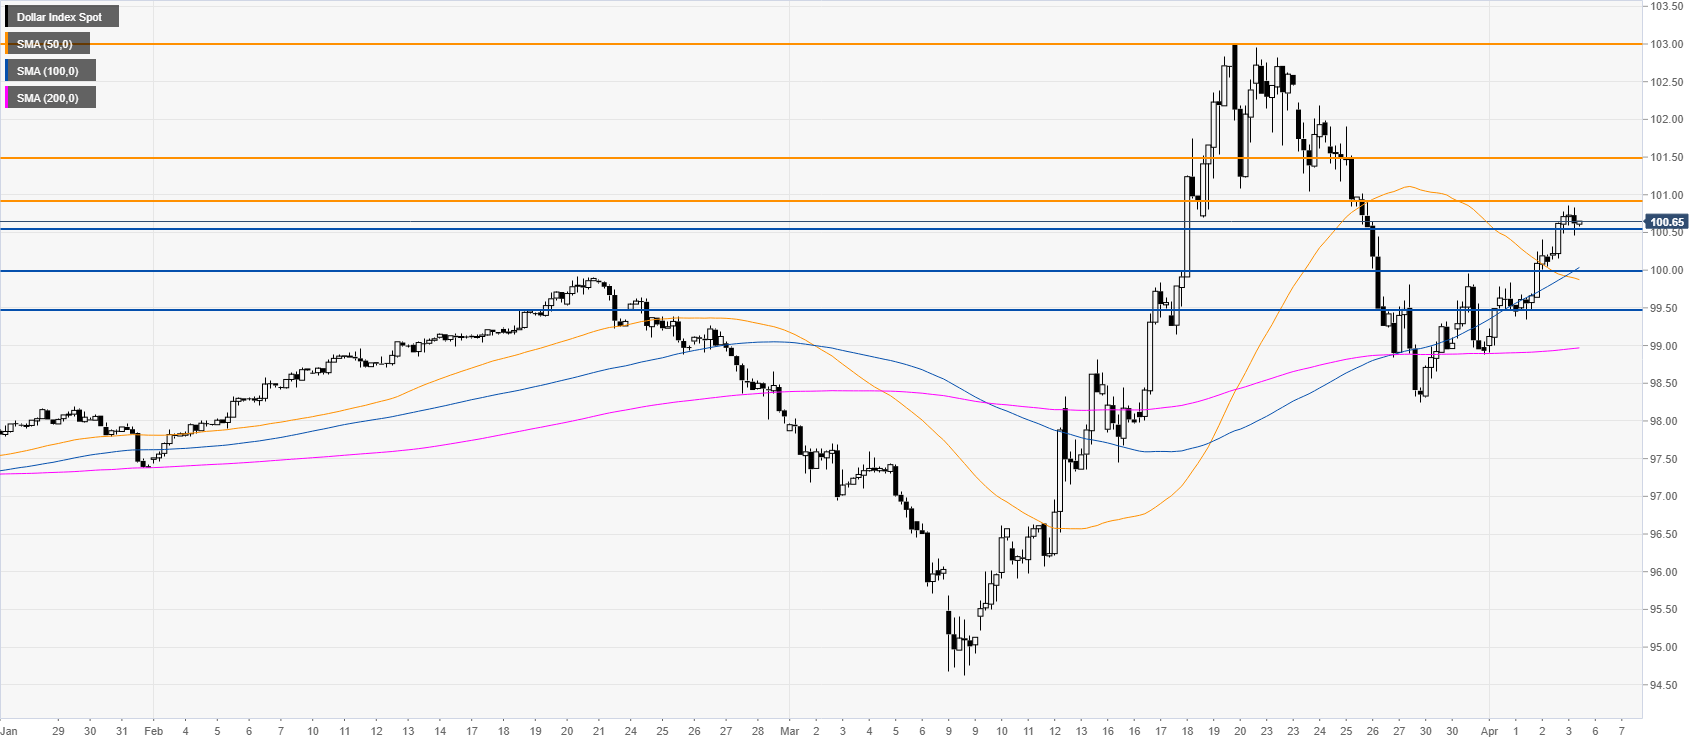
Additional key levels
