- DXY prints mild gains while refreshing intraday top.
- Corrective pullback looks set to test monthly resistance line.
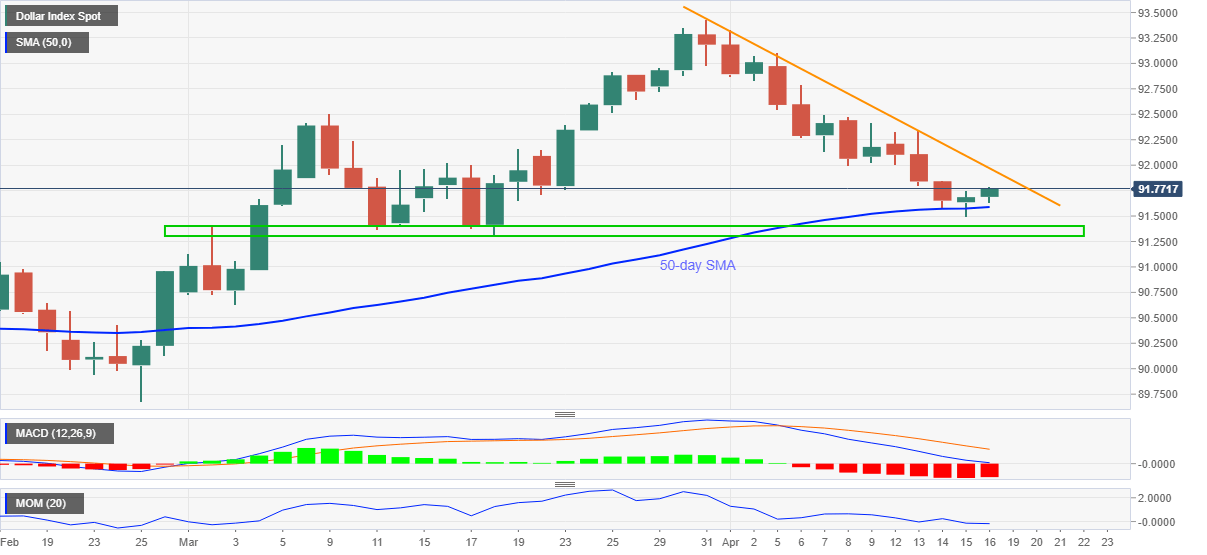
- Bearish MACD, downbeat Momentum favor greenback sellers, 1.5-month-old horizontal support becomes the key.
US dollar index (DXY) takes bids around 91.80, up 0.10% intraday, during early Friday. The greenback gauge dropped to the lowest since March 18 the previous day before bouncing off 50-day SMA to print the first positive daily closing of the week.
The corrective pullback has legs to test the downward sloping trend line from March 31, around 91.96.
However, any further upside will be challenged by the bearish MACD signals and downbeat Momentum.
Should the quote rises beyond 91.96, also clears the 92.00 threshold, the early March top near 92.50 should return to the charts.
On the flip side, a daily closing below the 50-day SMA level of 91.59 isn’t the call to DXY sellers as a horizontal area comprising multiple levels since March 02, around 91.30-40, becomes the key support.
DXY daily chart
Trend: Further recovery expected
