- DXY is recovering slightly from the December 2019 lows.
- The bounce could reach the 97.00/97.20 price zone.
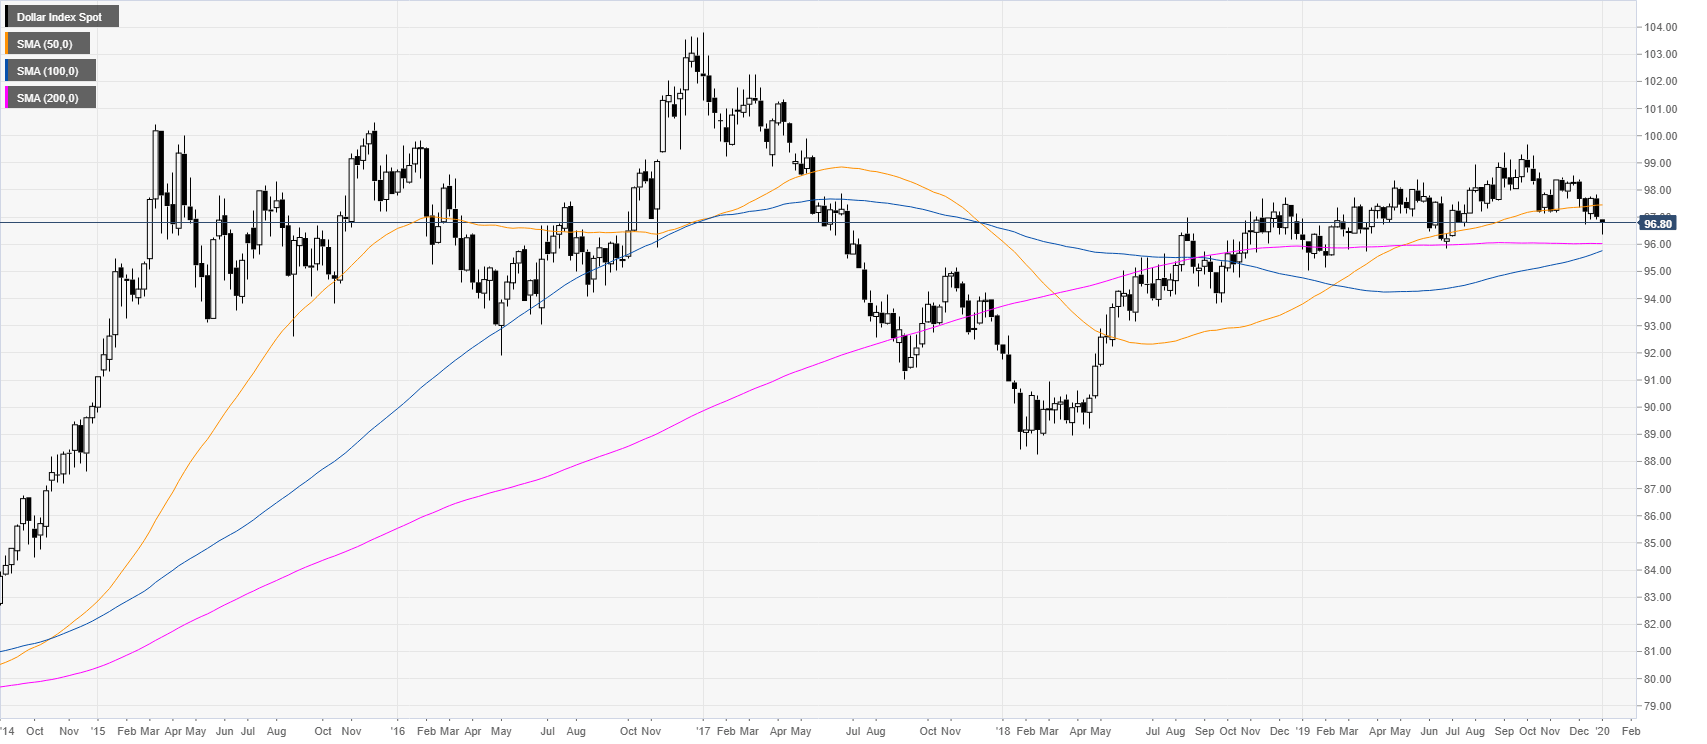
DXY weekly chart
DXY (US Dollar Index) is starting 2020, trading just below the 97.00 handle in the middle of the 2019 range.
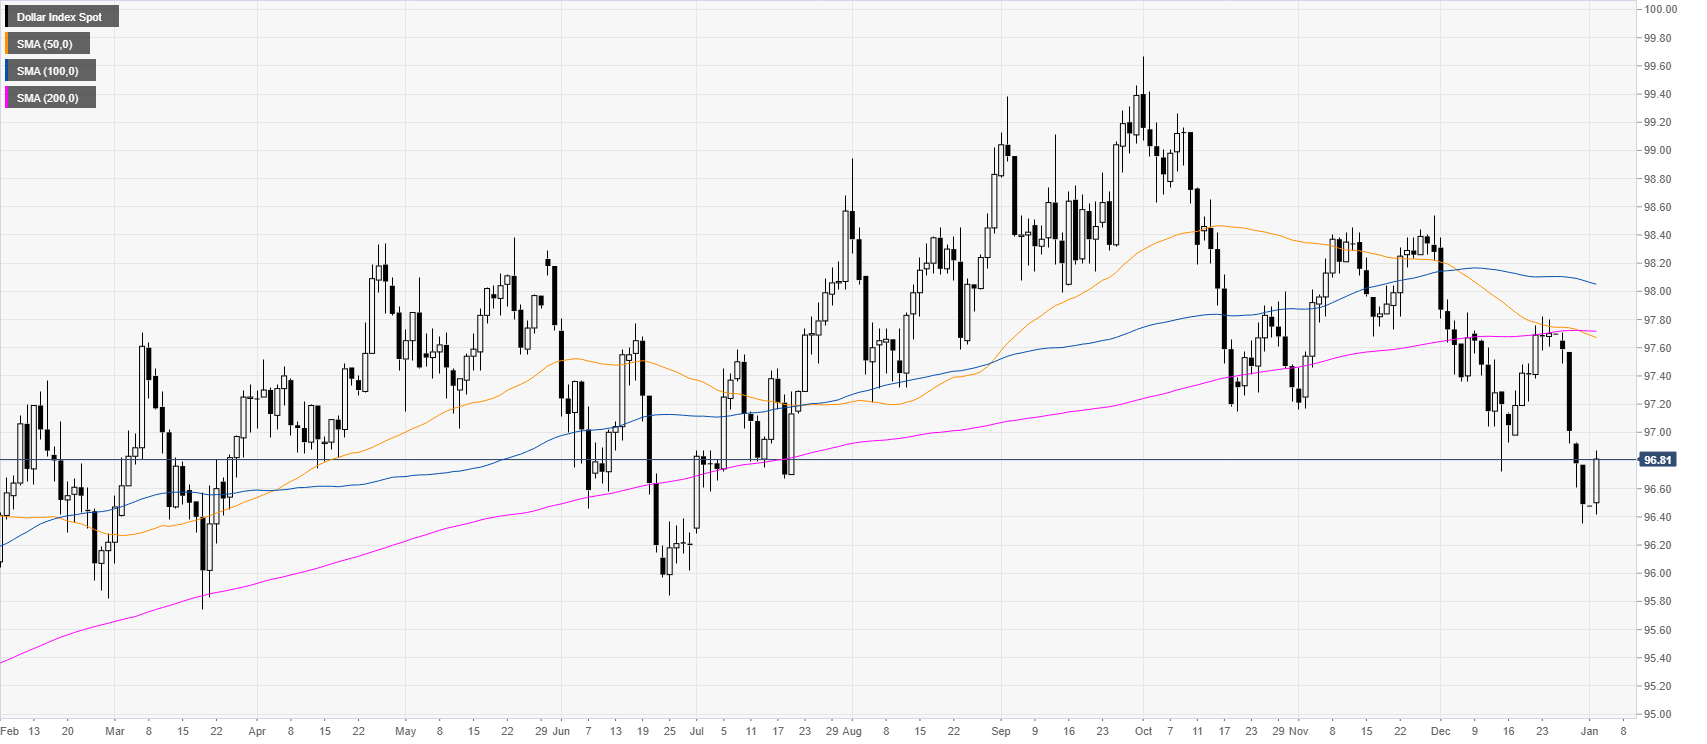
DXY daily chart
The greenback had a bounce from the December 2019 lows on the first trading day of 2020, while the market is trading below the 200-day simple moving average (SMA). If the buyers are not able to reclaim the 98.00 handle, 2020 could be a down year for DXY.
DXY four-hour chart
The market is trading below the main SMAs. However, DXY is having a bounce and buyers could try to reach the 97.00 and 97.20 level near the 50/100 SMAs. Further up lie the 97.60 level.
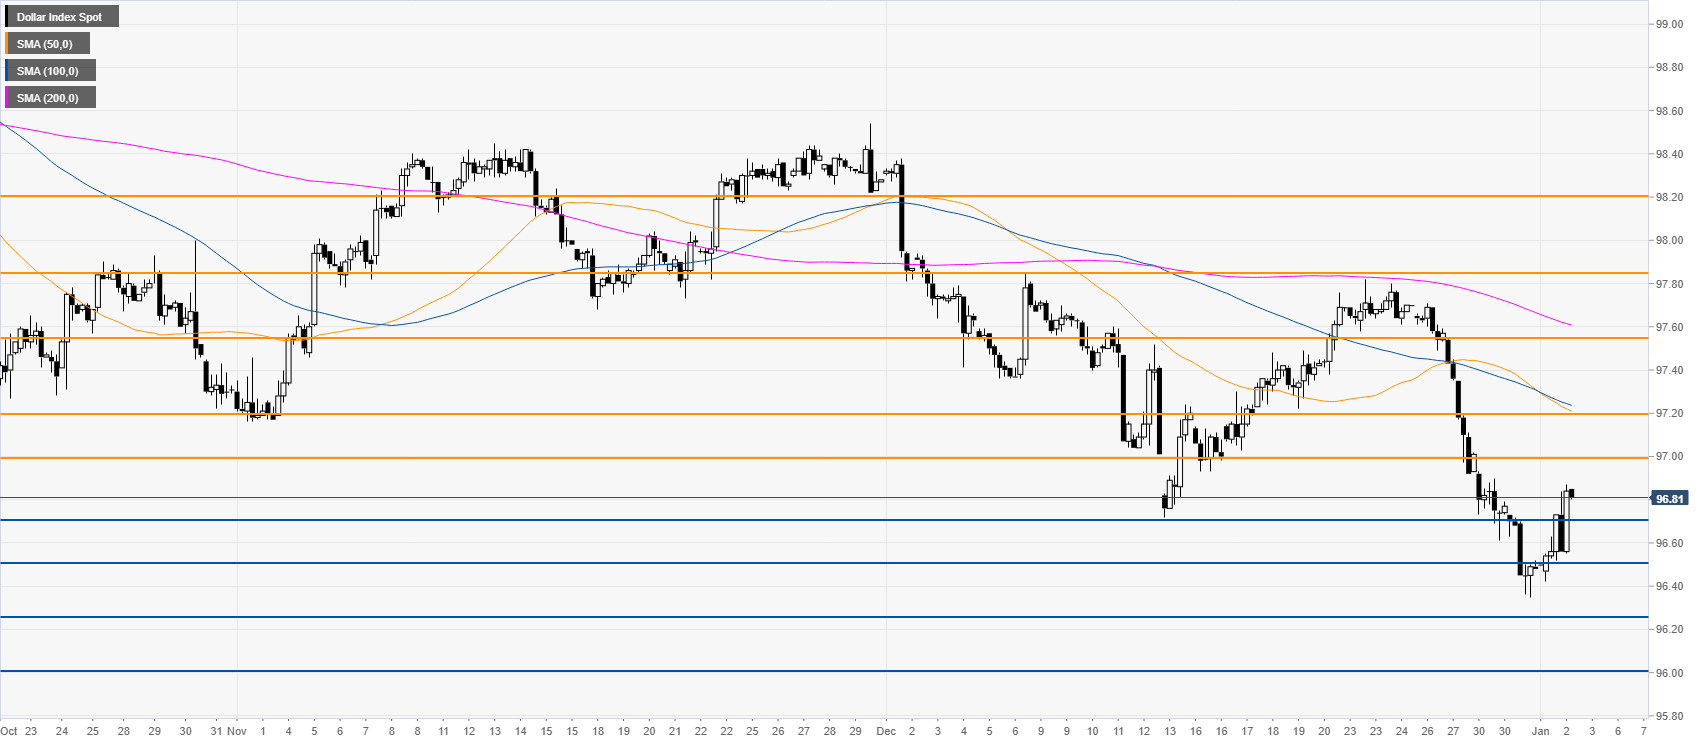
Additional key level
