- DXY is rolling into Asia below the 96.70 resistance.
- A break below 96.50 could lead to further losses towards the 96.25 and 96.00 levels.
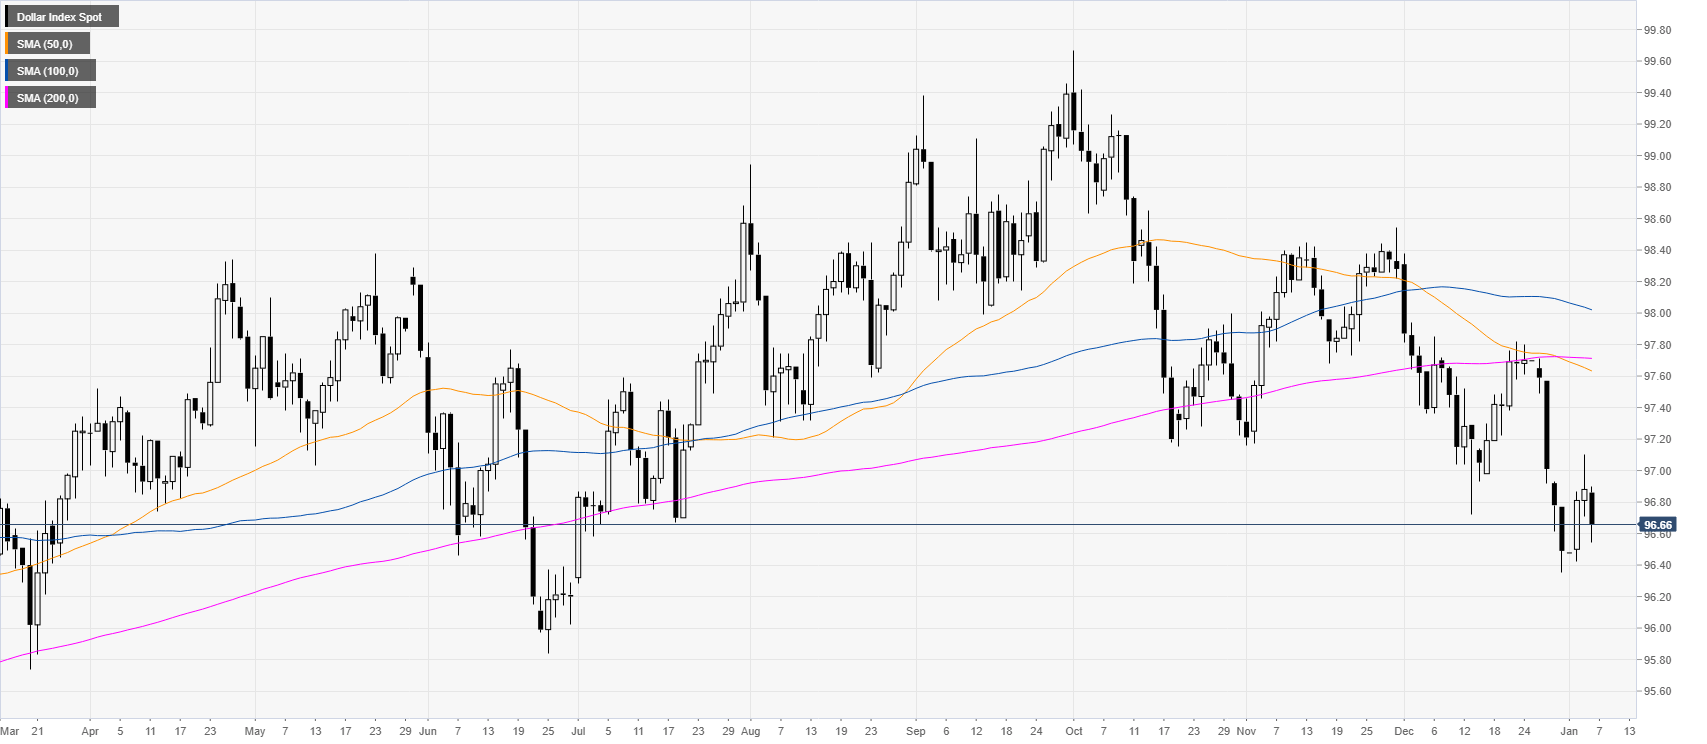
DXY daily chart
The greenback stays under selling pressure below its main daily simple moving average (SMAs). DXY is having a slow start of the year, searching for a clear direction.
DXY four-hour chart
The market is consolidating losses below the 96.70 level and the main SMAs. Bears want a break below 96.50 to reach 96.25 and 96.00 levels. On the flip side, a daily close above the 97.20 would likely question the bearish case in the medium term.
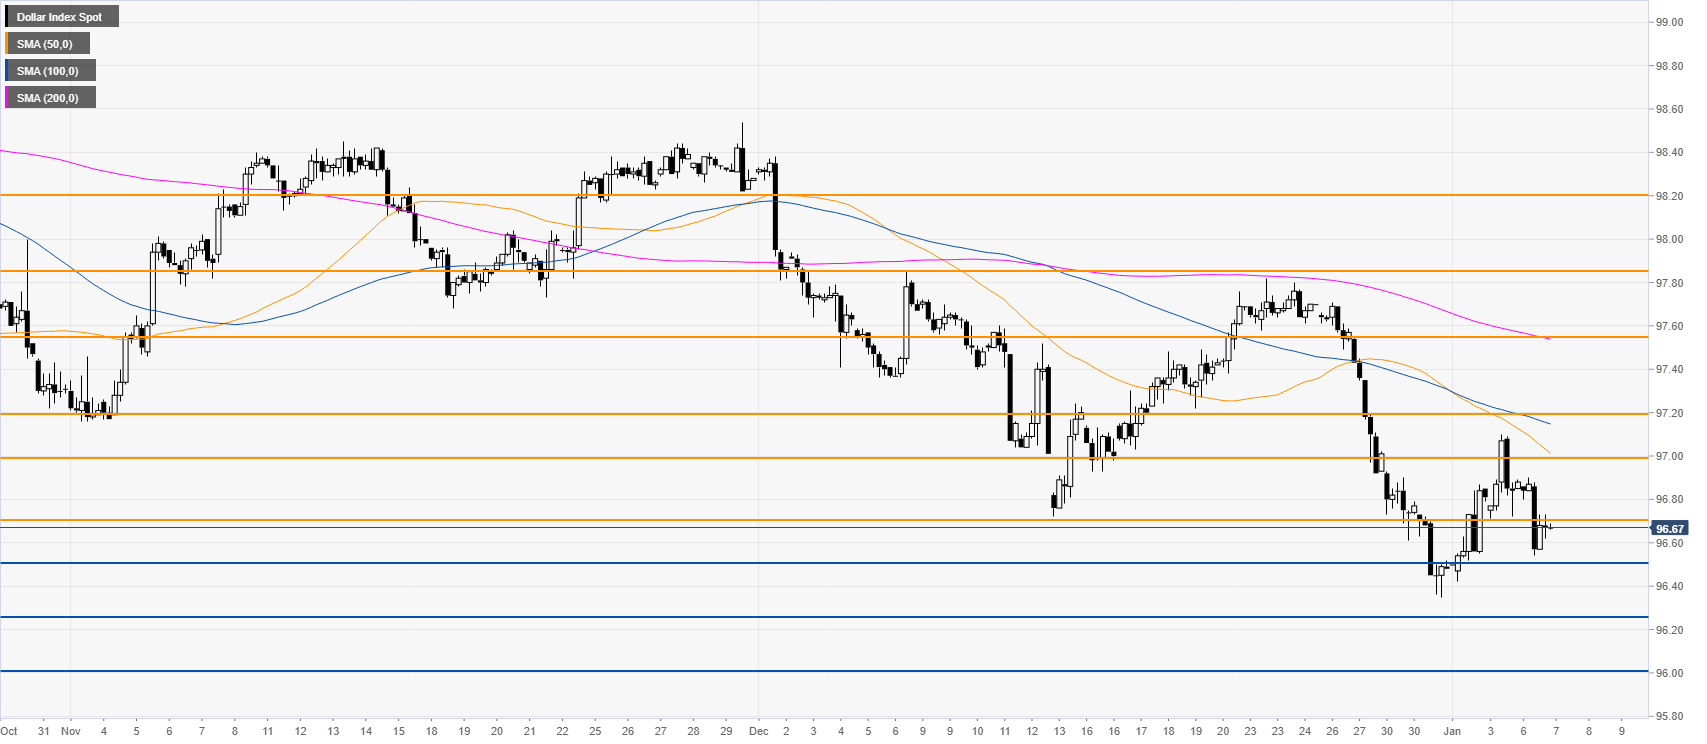
Additional key level
