- US Dollar Index (DXY) stalls decline, not out of the woods yet.
- Symmetrical triangle breakdown in play on 1H chart.
- Bearish crossover and RSI adds credence to the additional downside.
The US dollar index (DXY) wallows multi-day lows near 90.60, courtesy of the coronavirus vaccine progress and no signs of a breakthrough in the US fiscal stimulus talks.
The bears retain control heading into the US PPI and Consumer Sentiment releases, especially after Thursday’s discouraging Jobless Claims report.
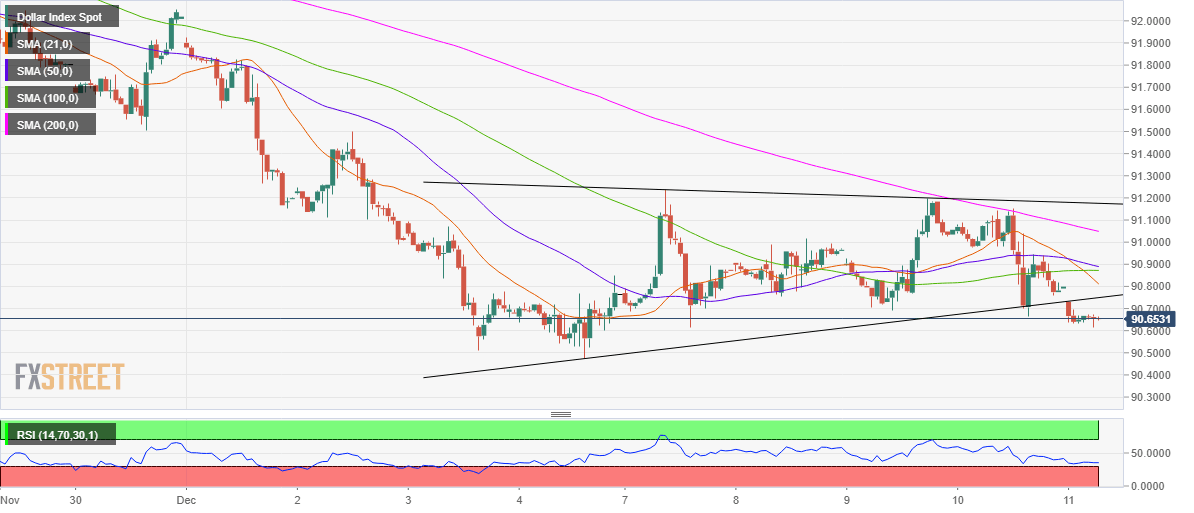
From a near-term technical perspective, the risks remain skewed to the downside in the DXY following the symmetrical triangle breakdown confirmed on the hourly sticks earlier in the Asian session.
The bearish crossover spotted on the given time frame further backs the case for additional downside. The 21-hourly moving average (HMA) has pierced both the 50 and 100-HMAs from above.
Meanwhile, the Relative Strength Index (RSI) points south at 35.13 while trading just above the oversold territory, suggesting that there is more scope for declines.
Therefore, bears eye the December 4 low of 90.47 before heading for a test of the measured pattern target of 89.97.
On the flip side, any recovery attempts could face strong offers at 90.75, the triangle support now resistance. Further, the 21-HMA resistance at 90.81 could be threatened.
DXY hourly chart