- DXY eases back towards the lowest since April 2018 refreshed in Asia.
- Two-week-old horizontal resistance, 200-HMA add to the upside filters.
- April 2018 bottom, two-year low lure US dollar sellers.
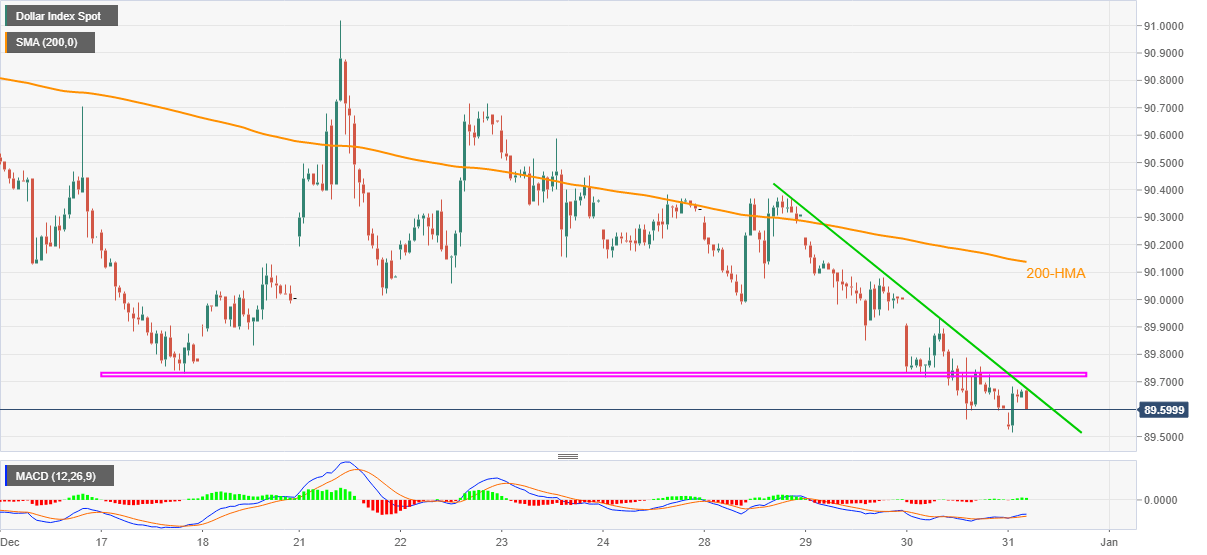
US dollar index (DXY) fades recent bounces off 32-month low while receding to 89.60 during the early Thursday. In doing so, the greenback gauge reverses the recovery gains from the multi-month low, marked during the Asian session, amid failures to cross the immediate resistance line.
Not only a descending trend line from Monday, currently around 89.67, but a horizontal area including lows marked since December 17, near 89.71/73 also challenges the DXY’s immediate upside amid sluggish MACD signals.
Even if the US dollar index crosses 89.73, it needs to surpass the 90.00 round-figure and 200-HMA near 90.18 to recall the short-term buyers.
Meanwhile, the latest low, also the multi-day bottom, near 89.50, pops on the DXY sellers’ radars as an immediate target.
However, their ultimate goal could be to revisit the year 2018 trough surrounding 88.25. In doing so, April 2018 low near 89.20 can offer an intermediate halt.
DXY hourly chart
Trend: Bearish
