- US dollar index (DXY) trims the previous day’s gains.
- MACD losses bullish bias below the key EMAs.
- Immediate horizontal support lures the bears ahead of September low.
DXY sellers retake control while flashing 0.15% intraday losses, currently down around 92.70, during the early Tuesday. The greenback gauge bounced off a 10-week low on Monday before stepping back from 100-hour EMA.
Not only the sustained pullback from the important EMA resistance but receding strength of the MACD bullish signals also favor the US dollar index bears.
Hence, a horizontal area comprising multiple levels marked since last Thursday around 92.45 becomes the immediate concern of sellers ahead of directing the greenback towards the monthly low of 92.13.
Should the US currency stays weak below 92.13, the 92.00 round-figures and September month’s low surrounding 91.75 will be in the spotlight.
Alternatively, a clear break of the 100-hour EMA level of 92.85 doesn’t guarantee the bulls’ return as 200-hour EMA, currently around 93.10, also stands tall to challenge the upside momentum.
DXY hourly chart
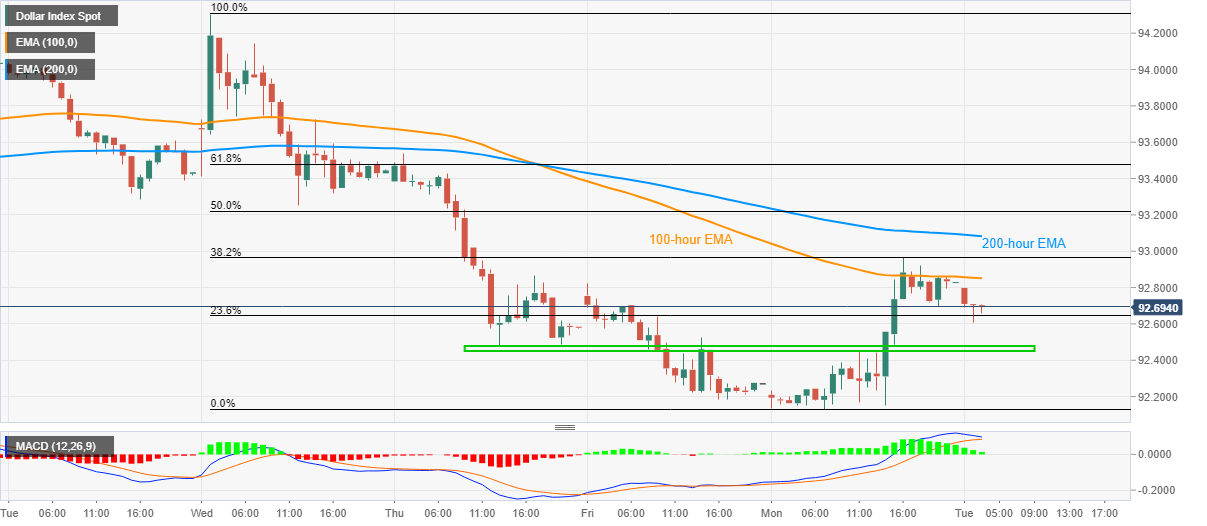
Trend: Bearish
