- DXY’s upside momentum falters around the 94.30 region.
- The 6-month support line holds the downside so far.
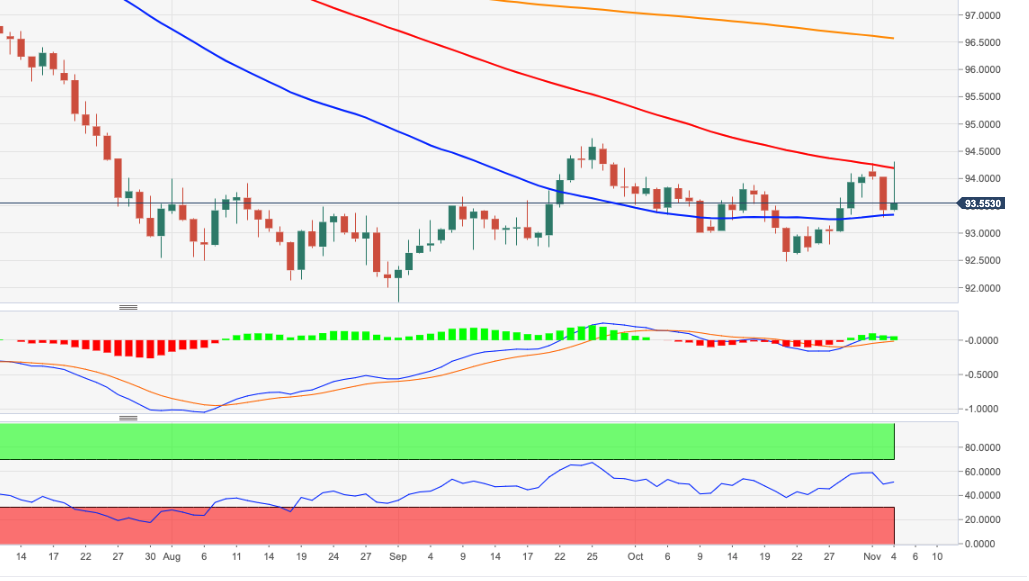
DXY advanced and failed around the 94.30/20 zone earlier in the session, where coincide a Fibo level (of the 2017-2018 drop) and the 100-day SMA.
The ongoing volatility and uncertainty surrounding the US elections should leave the very near-term outlook on the dollar unclear. That said, while the 94.30 area emerges as quite a decent up barrier, the 6-month (now support) line in the 93.00 neighbourhood is expected to hold an occasional downside test.
As long as DXY trades below the 200-day SMA, today at 96.56, the negative view is forecasted to persist.
DXY daily chart