- US dollar index (DXY) lost some steam this week below the 50 SMA on the daily chart.
- The level to beat for bears is the 98.90 support.
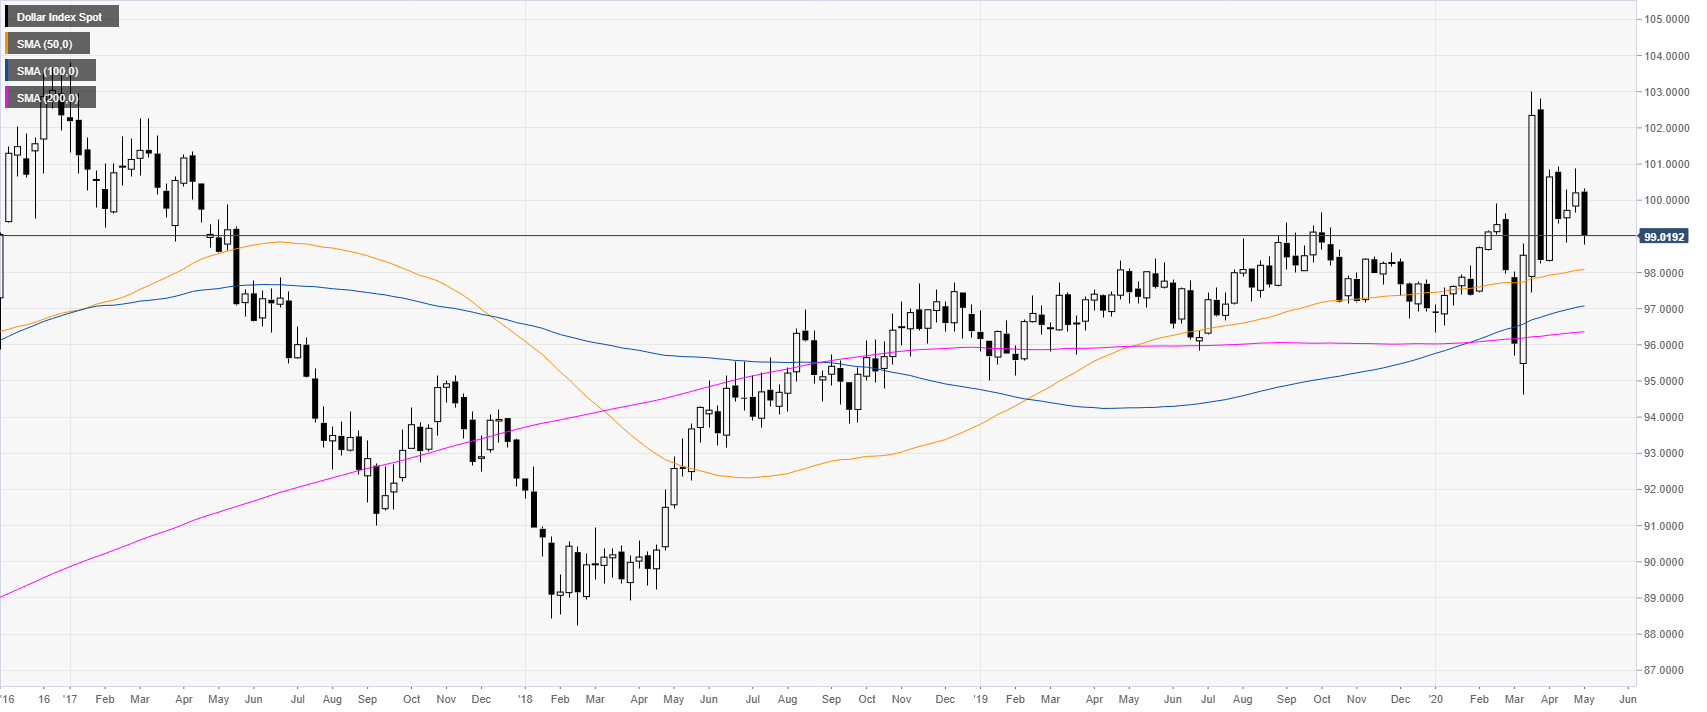
DXY weekly chart
The US Dollar Index (DXY) is trading in an uptrend above its weekly simple moving averages (SMAs) as the market printed a negative week and is above to close below the 100.00 mark.
DXY daily chart
DXY is starting the month of May mixed but still in a bear leg below the 50 SMA on the daily chart. Next week the market will try to break below the 98.90 support level to open the gate to further losses towards the 98.25 and 97.50 levels on the medium-term. Meanwhile bullish attempts might find resistance near 99.30, 99.60 and the 100.00 mark.
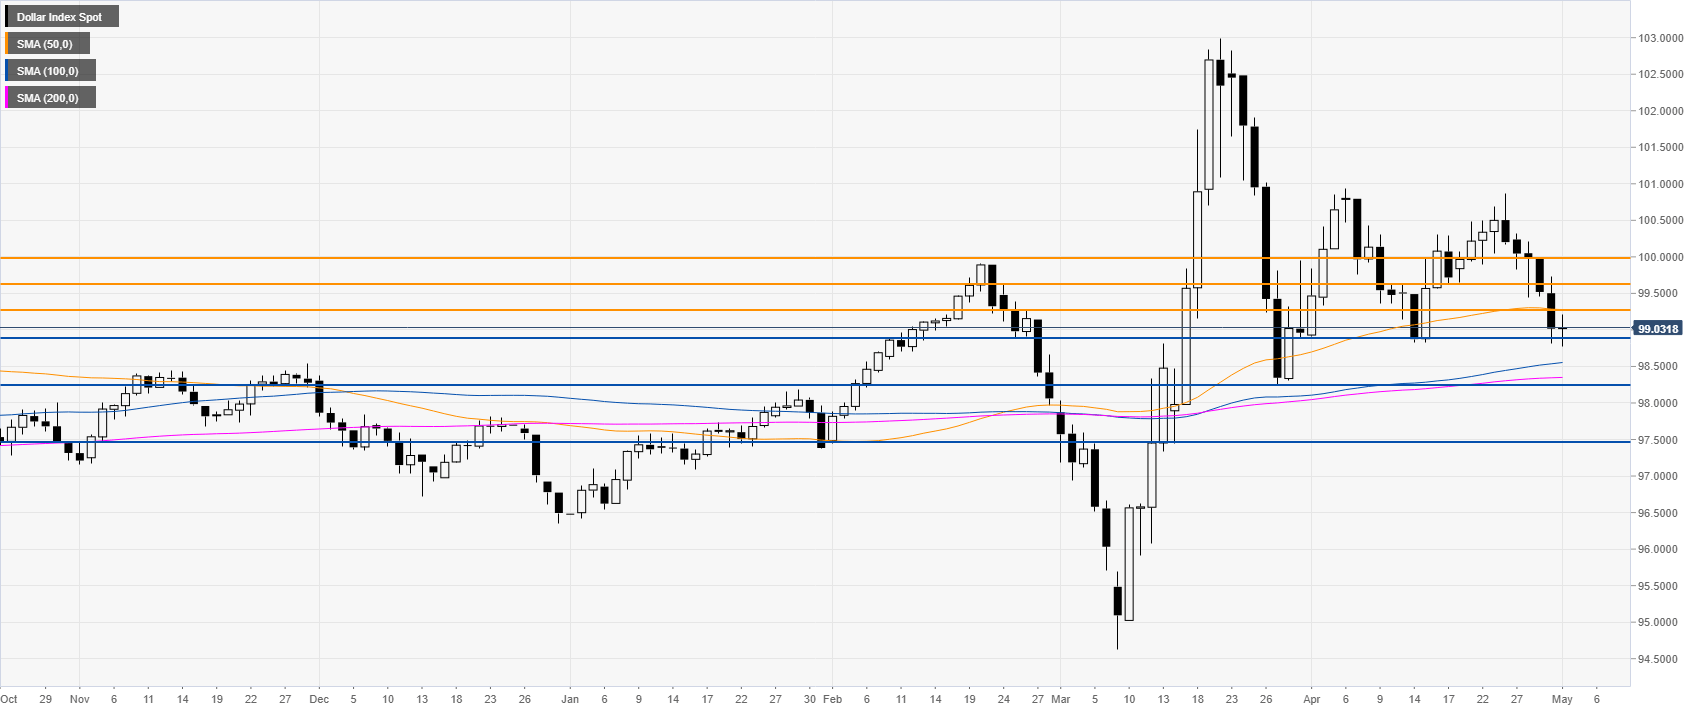
Additional key levels
