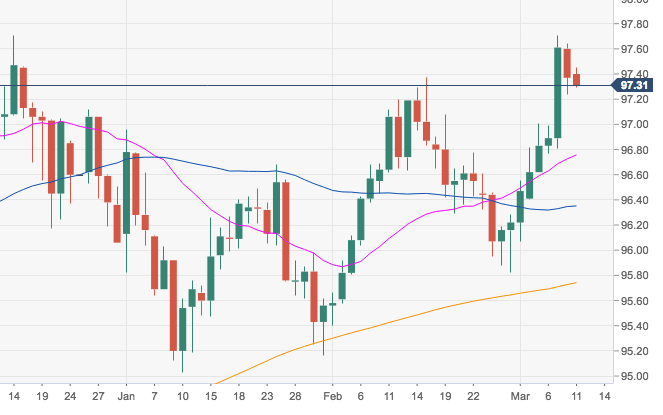
- DXY is losing further ground on Monday, receding to the 97.30 region after climbing to fresh 2019 tops in the 97.70/75 band on Thursday.
- The continuation of the selling impetus is seen facing strong contention in the 96.75 region, where coincide the 21-day and 10-day SMAs.
- The constructive stance in the buck should stay unchanged while above the critical 200-day SMA at 95.74
DXY daily chart
Dollar Index Spot
Overview:
Today Last Price: 97.32
Today Daily change: 16 pips
Today Daily Open: 97.37
Trends:
Daily SMA20: 96.73
Daily SMA50: 96.3
Daily SMA100: 96.54
Daily SMA200: 95.73
Levels:
Previous Daily High: 97.64
Previous Daily Low: 97.24
Previous Weekly High: 97.71
Previous Weekly Low: 96.4
Previous Monthly High: 97.37
Previous Monthly Low: 95.4
Daily Fibonacci 38.2%: 97.39
Daily Fibonacci 61.8%: 97.49
Daily Pivot Point S1: 97.19
Daily Pivot Point S2: 97.02
Daily Pivot Point S3: 96.79
Daily Pivot Point R1: 97.59
Daily Pivot Point R2: 97.82
Daily Pivot Point R3: 97.99
