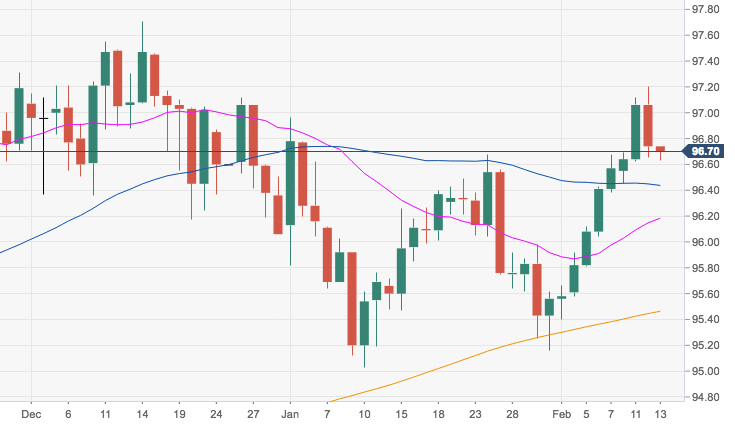
- DXY clinched fresh yearly highs at 97.20 on Tuesday, although sellers turned up soon afterwards, sponsoring the ongoing knee-jerk.
- Initial contention emerges at the 96.40 region, where sits the key 55-day SMA, while the constructive bias is seen unchanged as long as the200-day SMA near 95.50 underpins.
- A surpass of recent YTD peaks should focus the attention on 2018 highs around 97.70.
DXY daily chart
Dollar Index Spot
Overview:
Today Last Price: 96.71
Today Daily change: 10 pips
Today Daily change %: -0.03%
Today Daily Open: 96.74
Trends:
Daily SMA20: 96.16
Daily SMA50: 96.39
Daily SMA100: 96.29
Daily SMA200: 95.45
Levels:
Previous Daily High: 97.2
Previous Daily Low: 96.65
Previous Weekly High: 96.69
Previous Weekly Low: 95.58
Previous Monthly High: 96.96
Previous Monthly Low: 95.03
Daily Fibonacci 38.2%: 96.86
Daily Fibonacci 61.8%: 96.99
Daily Pivot Point S1: 96.53
Daily Pivot Point S2: 96.31
Daily Pivot Point S3: 95.98
Daily Pivot Point R1: 97.08
Daily Pivot Point R2: 97.41
Daily Pivot Point R3: 97.63
