- US Dollar Index (DXY) remains positive after Thursday’s Doji candle on D1 chart.
- A rising trend-line since June 25, 50-DMA limit declines while 23.6% Fibonacci retracement acts as immediate resistance.
Having flashed a Doji candle on the daily chart, DXY takes the bids to 98.43 during early Friday.
A trend reversal formation indicates further recovery of losses made due to the previous pullback from 99.38. However, 23.6% Fibonacci retracement level of June-September upside, at 98.54, can act as immediate resistance.
If bulls manage to dominate past-99.38, 100.00 round-figure will appear on their radar.
On the flip slide, the 10-week-old rising trend-line, at 98.00, followed by 50-day simple moving average (DMA) level of 97.77 can keep the declines limited ahead of highlighting 50% and 61.8% Fibonacci retracement levels at 97.61 and 97.19 respectively.
DXY daily chart
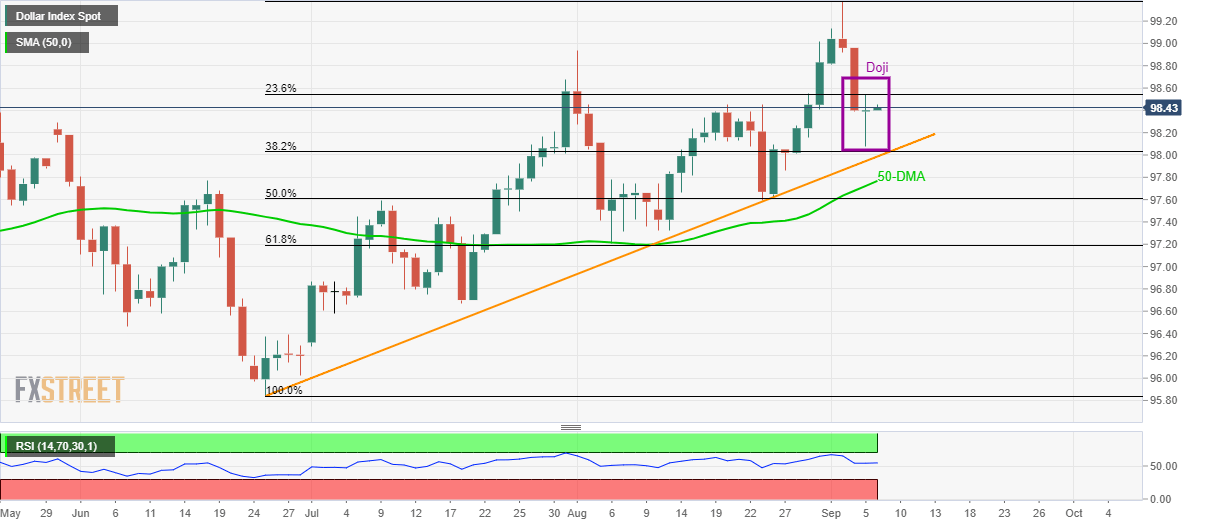
Trend: bullish
