- DXY (US Dollar Index) is ending Tuesday just above the 98.10 support level.
- The levels to beat for bears are at 98.10 and 97.95.
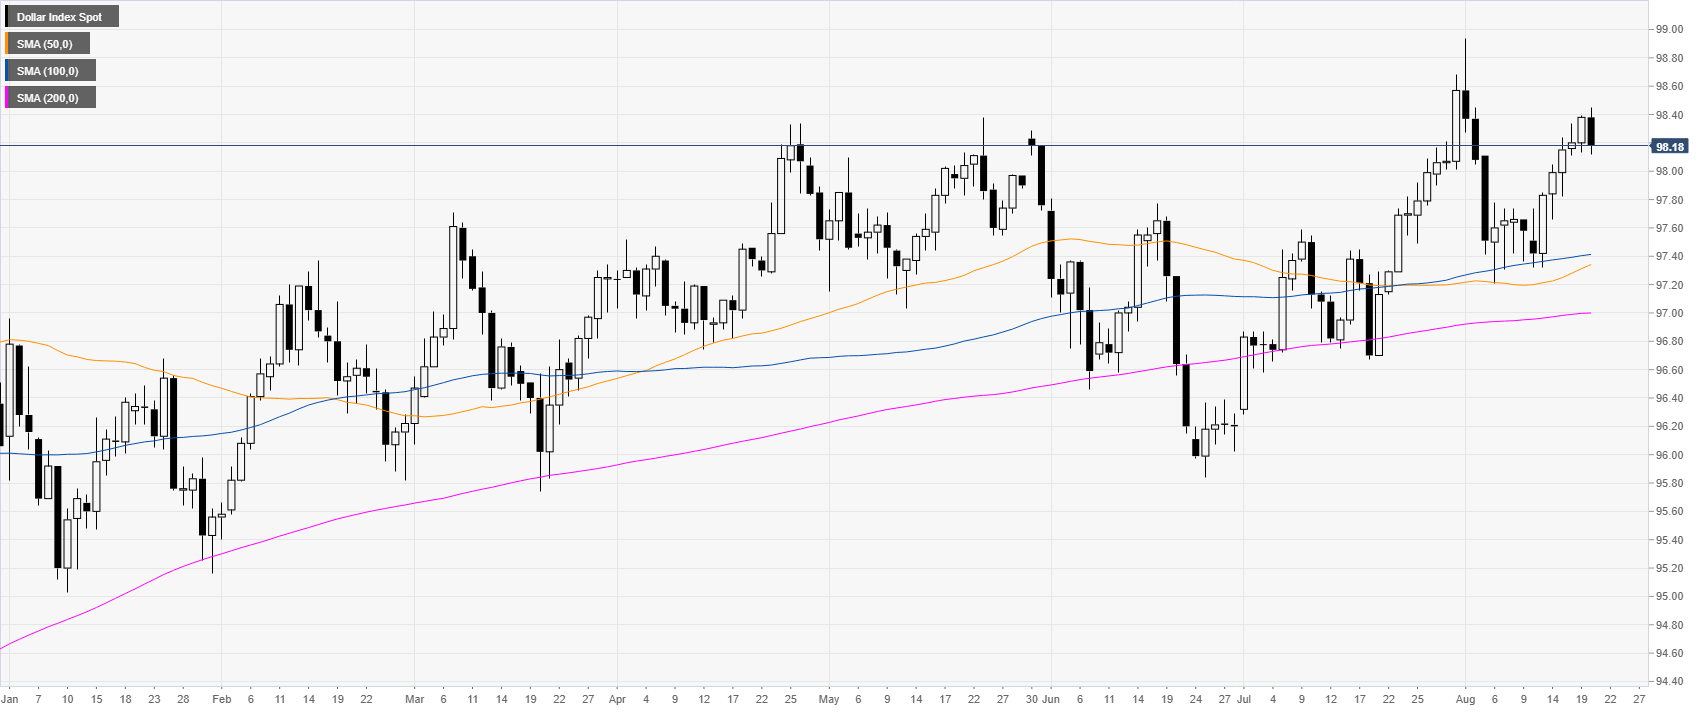
DXY daily chart
DXY (US Dollar Index) trading in a bull trend above its main daily simple moving averages (DSMAs). DXY lost momentum this Tuesday.
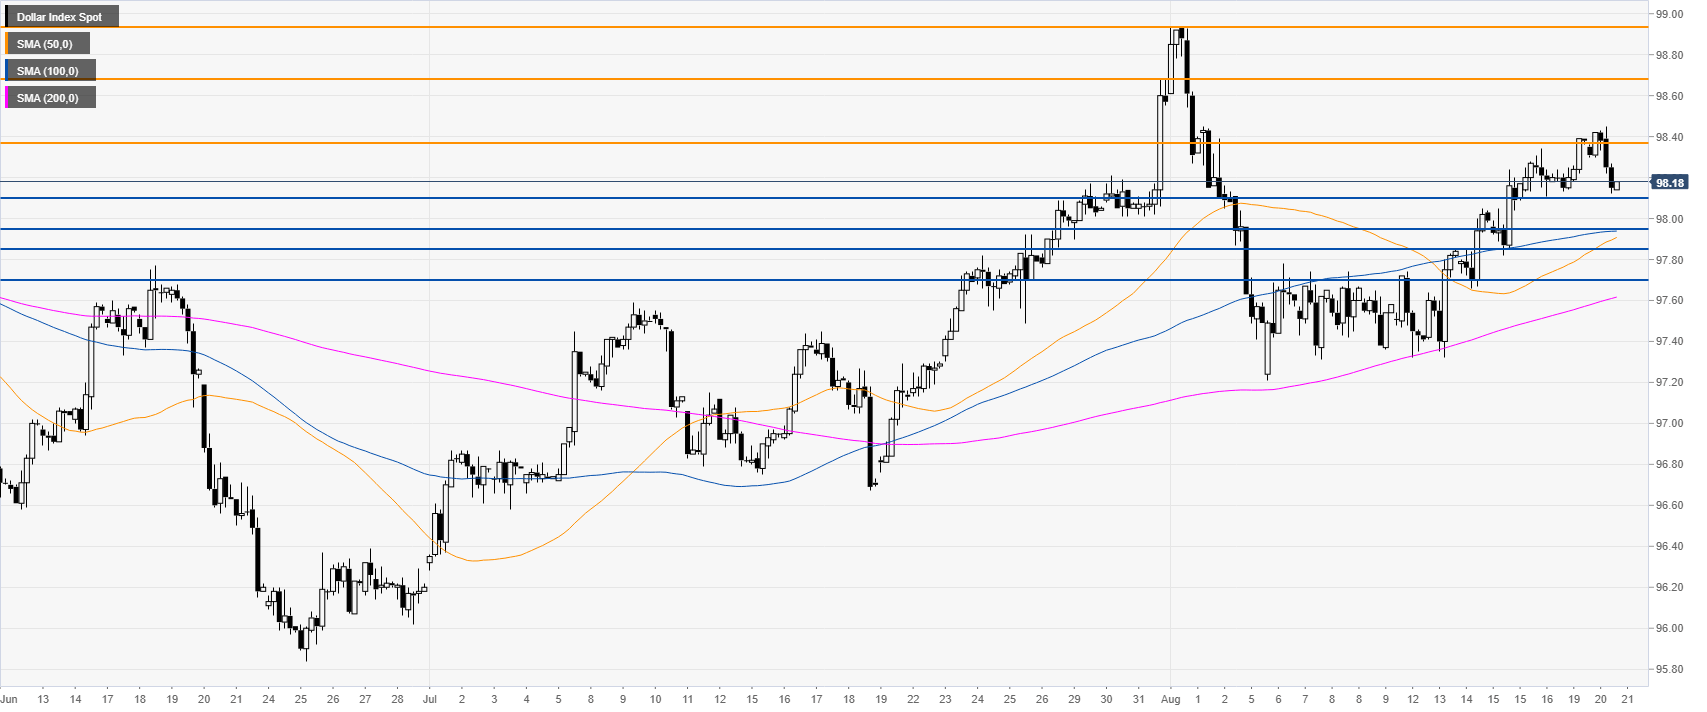
DXY 4-hour chart
DXY is retracing below the 98.38 level. A break below 98.11 can lead to further losses towards 97.95 and 97.85 support levels.
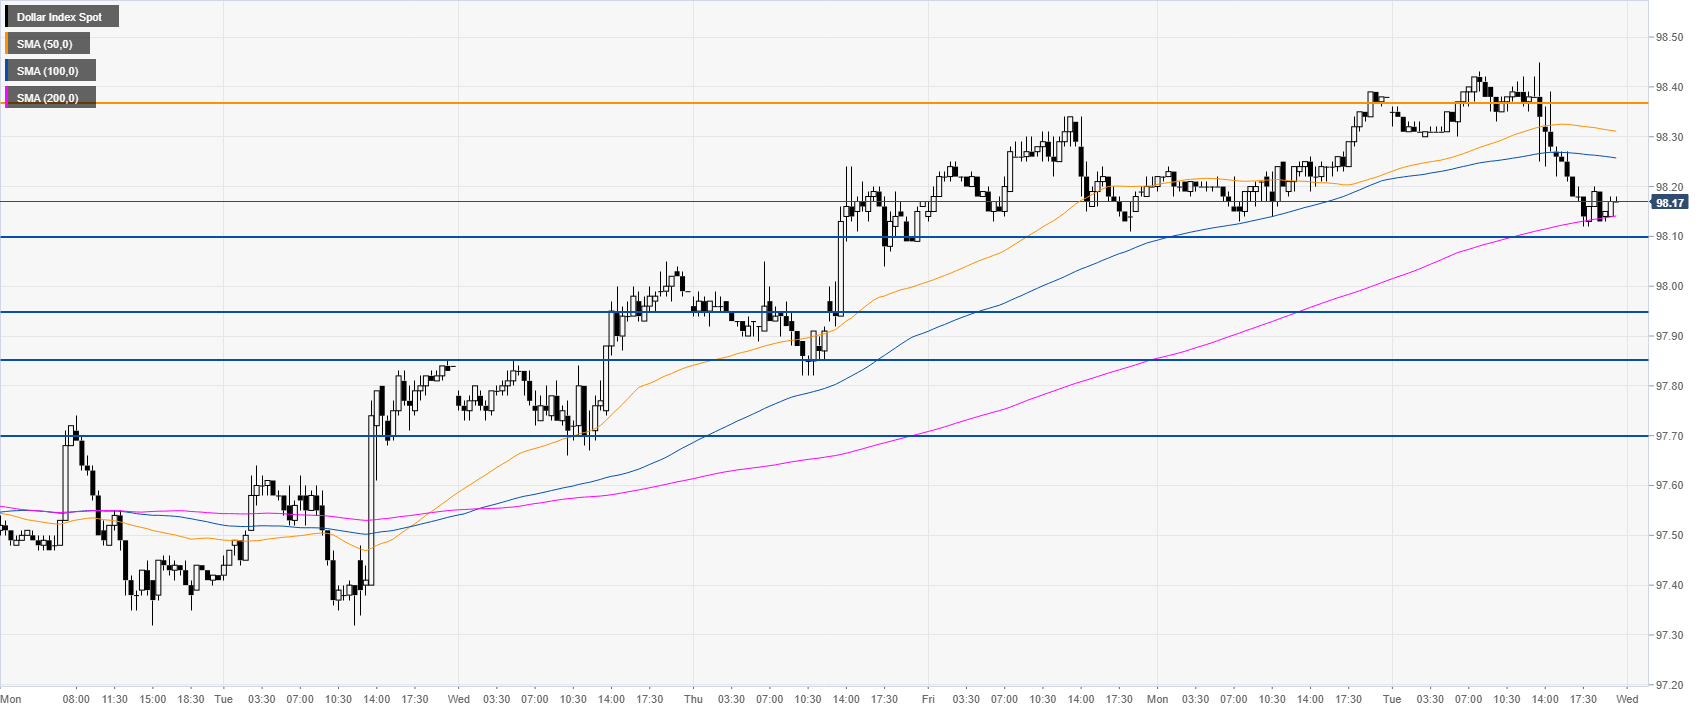
DXY 30-minute chart
The Greenback is trading above an upward sloping 200 SMA, suggesting bullish momentum in the short term. However, if the market is unable to surpass the 98.38 resistance, DXY is likely to decline.
Additional key levels
